Exploring the Observer Dashboard: A Comprehensive Guide
Explore the comprehensive features of the Observer Dashboard in our latest blog post. Learn how to monitor your website’s uptime, performance, domain details, and much more to enhance site efficiency and user experience. Sign up for Observer today to start optimizing your online presence.
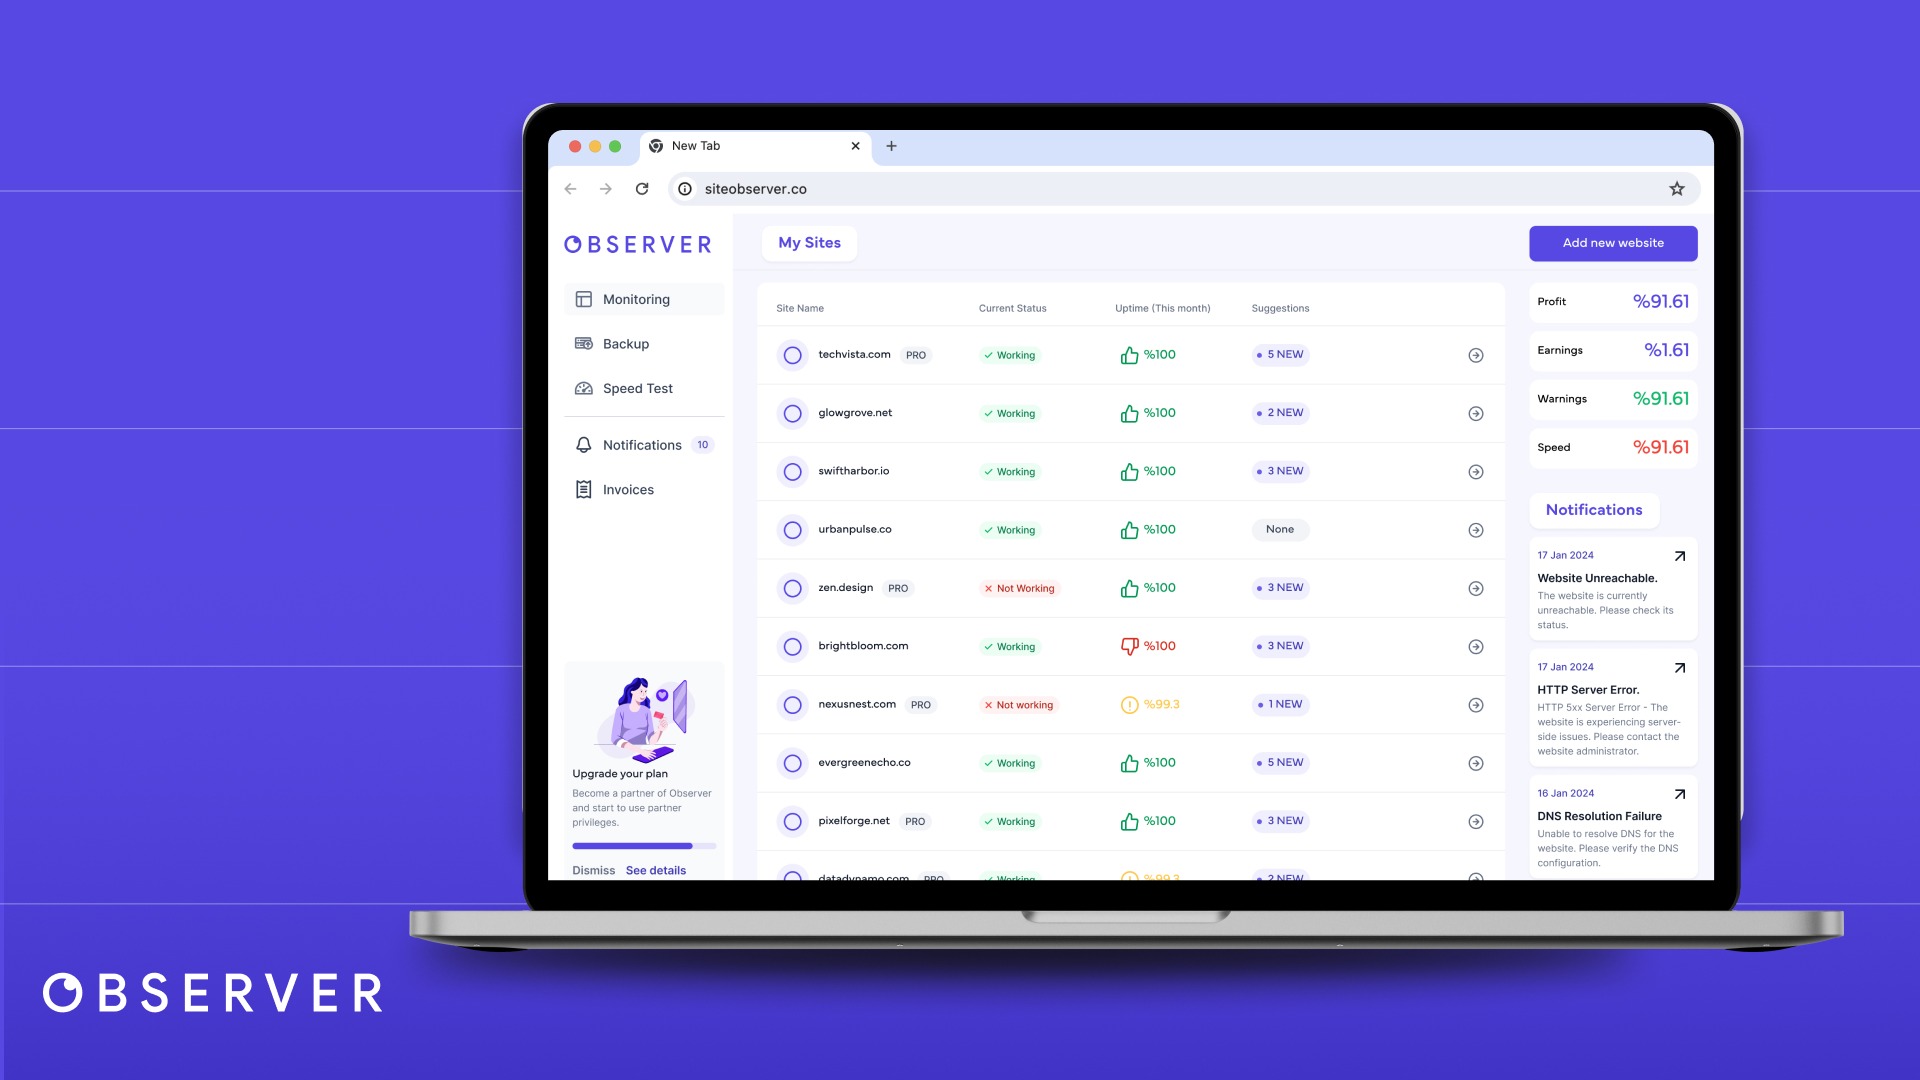
Observer dashboard is your new command center! It is designed to give you unparalleled insights into your website’s performance and health. From real-time monitoring to historical data analysis, each section of the dashboard offers valuable information to help you optimize and enhance your site’s functionality. Whether you’re troubleshooting issues or planning improvements, understanding how to read and use the Observer Dashboard effectively is key to maintaining a robust online presence.
In this post, we’ll walk you through each segment of the dashboard, explaining what data is available and how you can use it to make informed decisions about your website.
Left-hand Menu
Let’s delve into the different sections of the Observer Dashboard, accessed via the left-hand menu. This menu acts as your gateway to various analytics and data sets that provide insights into multiple aspects of your website’s performance.
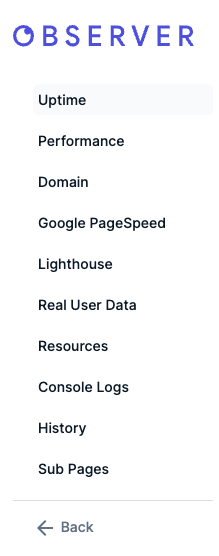
Each of these sections is designed to offer specific insights that, when combined, provide a comprehensive overview of your website’s health and performance. By understanding and utilizing these tools, you can ensure your site remains optimized, effective, and ahead of any potential issues.
Right Panel
The right column of the Observer Dashboard serves as a quick-reference panel, providing essential meta-information about your website at a glance. At the top, you’ll find the current status of your website, clearly indicating whether it is operational or experiencing issues. Below this, the dashboard displays the subscription plan you’re currently on, along with the date your site was added to Observer and the domain expiration date. This consolidated view helps you stay on top of critical administrative details without needing to navigate away from the dashboard.
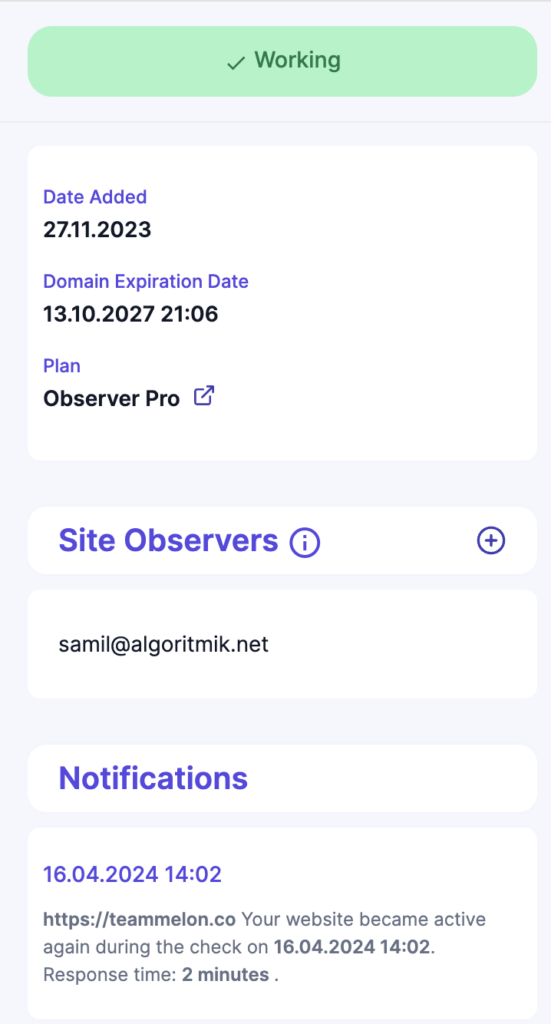
Further down, the right column also lists the ‘Observers’—the designated contacts such as email addresses and phone numbers that receive instant alerts about your website’s status. This section allows you to manage who gets notified in the event of a downtime or other significant incidents, ensuring that the right team members can respond swiftly to any issues. You can easily add or remove contacts as needed to keep your response team updated. At the bottom of this column, you’ll find a log of all past notifications related to your website, cataloged from the most recent back to the oldest. This historical record is invaluable for tracking past issues and resolutions, providing you with a timeline of events that can inform future troubleshooting and maintenance strategies.
Now that we’ve explored the right column of the Observer Dashboard, let’s turn our attention to the left menu. Here, we’ll delve into the various sections that provide detailed insights and analytics about your website. Each section offers specific data and tools designed to enhance your understanding and management of your site’s performance, security, and overall health. Let’s explore what each of these sections has to offer for comprehensive website monitoring.
Uptime
The “Uptime” section of the Observer Dashboard is your central resource for tracking the reliability and availability of your website. Here, you can closely monitor and understand the downtime incidents that affect your site. This section is crucial for maintaining optimal operational status and ensuring a high-quality user experience.
Within the Uptime section, you’ll first encounter the Downtime Periods table. This comprehensive table lists every instance of downtime that your site has experienced. It includes vital details such as the exact times and dates of each downtime event, the server responses received during these periods, and the duration of each incident. This data helps you identify patterns or recurring issues that may need addressing to improve your site’s stability.
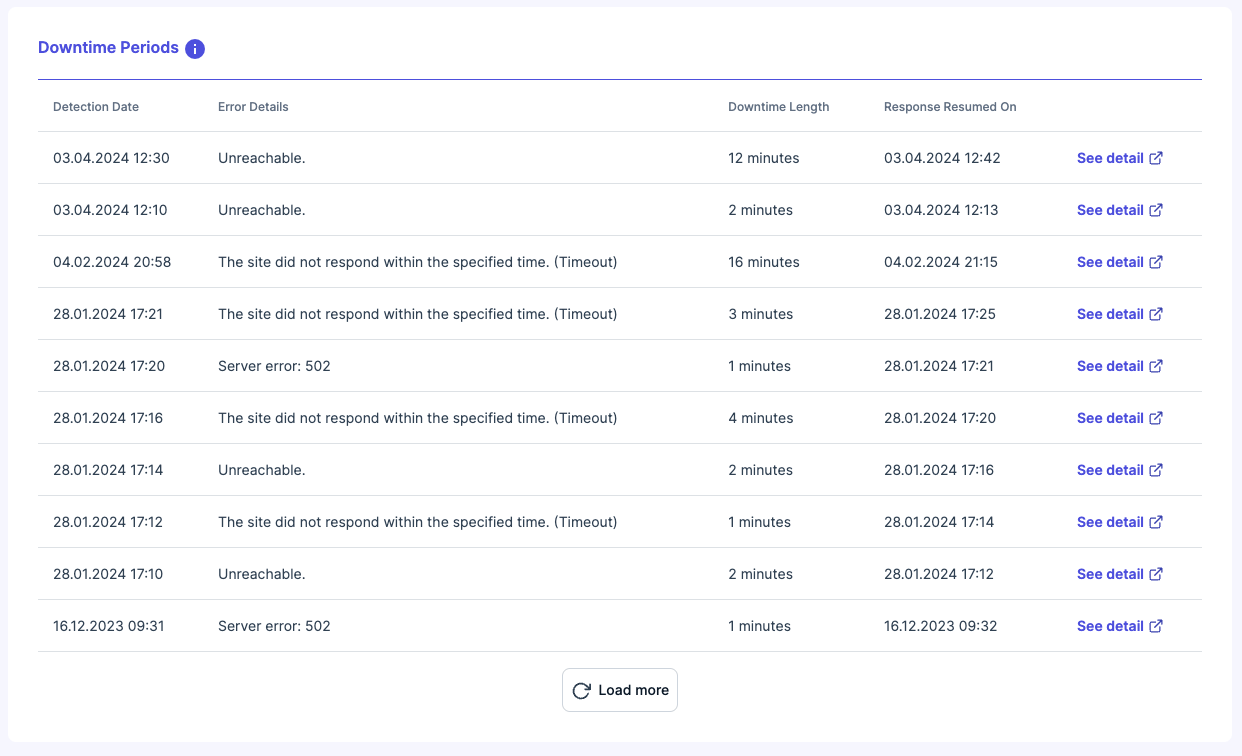
Additionally, for a more in-depth investigation, you can click on the ‘Details’ button next to each entry. This expands to show a screenshot captured at the time of the downtime, providing visual context that can be invaluable for diagnosing the issue more effectively.
Adjacent to the table, you’ll find a bar graph which presents a monthly overview of your website’s uptime performance. This visual representation makes it easy to spot trends in the total number of downtimes and their cumulative durations over each month. By reviewing this chart, you can quickly assess the effectiveness of any changes or improvements you’ve implemented and gauge their impact on your website’s uptime.
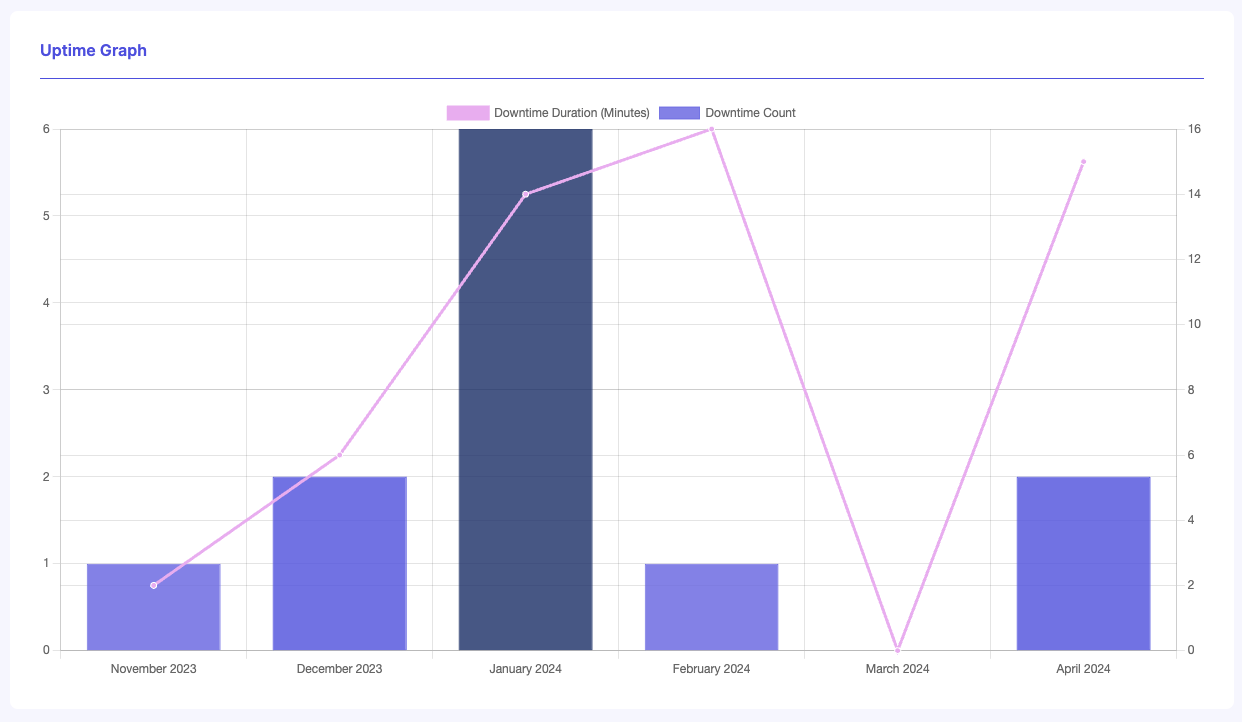
Together, these tools within the Uptime section give you a powerful means to monitor your website’s operational status, analyze downtime causes, and take necessary actions to minimize future disruptions. This ensures your site remains accessible to users, providing a reliable and consistent online experience.
Performance
In the Performance section of the Observer Dashboard, you’re equipped with tools and data designed to enhance and scrutinize the loading efficiency of your website comprehensively.
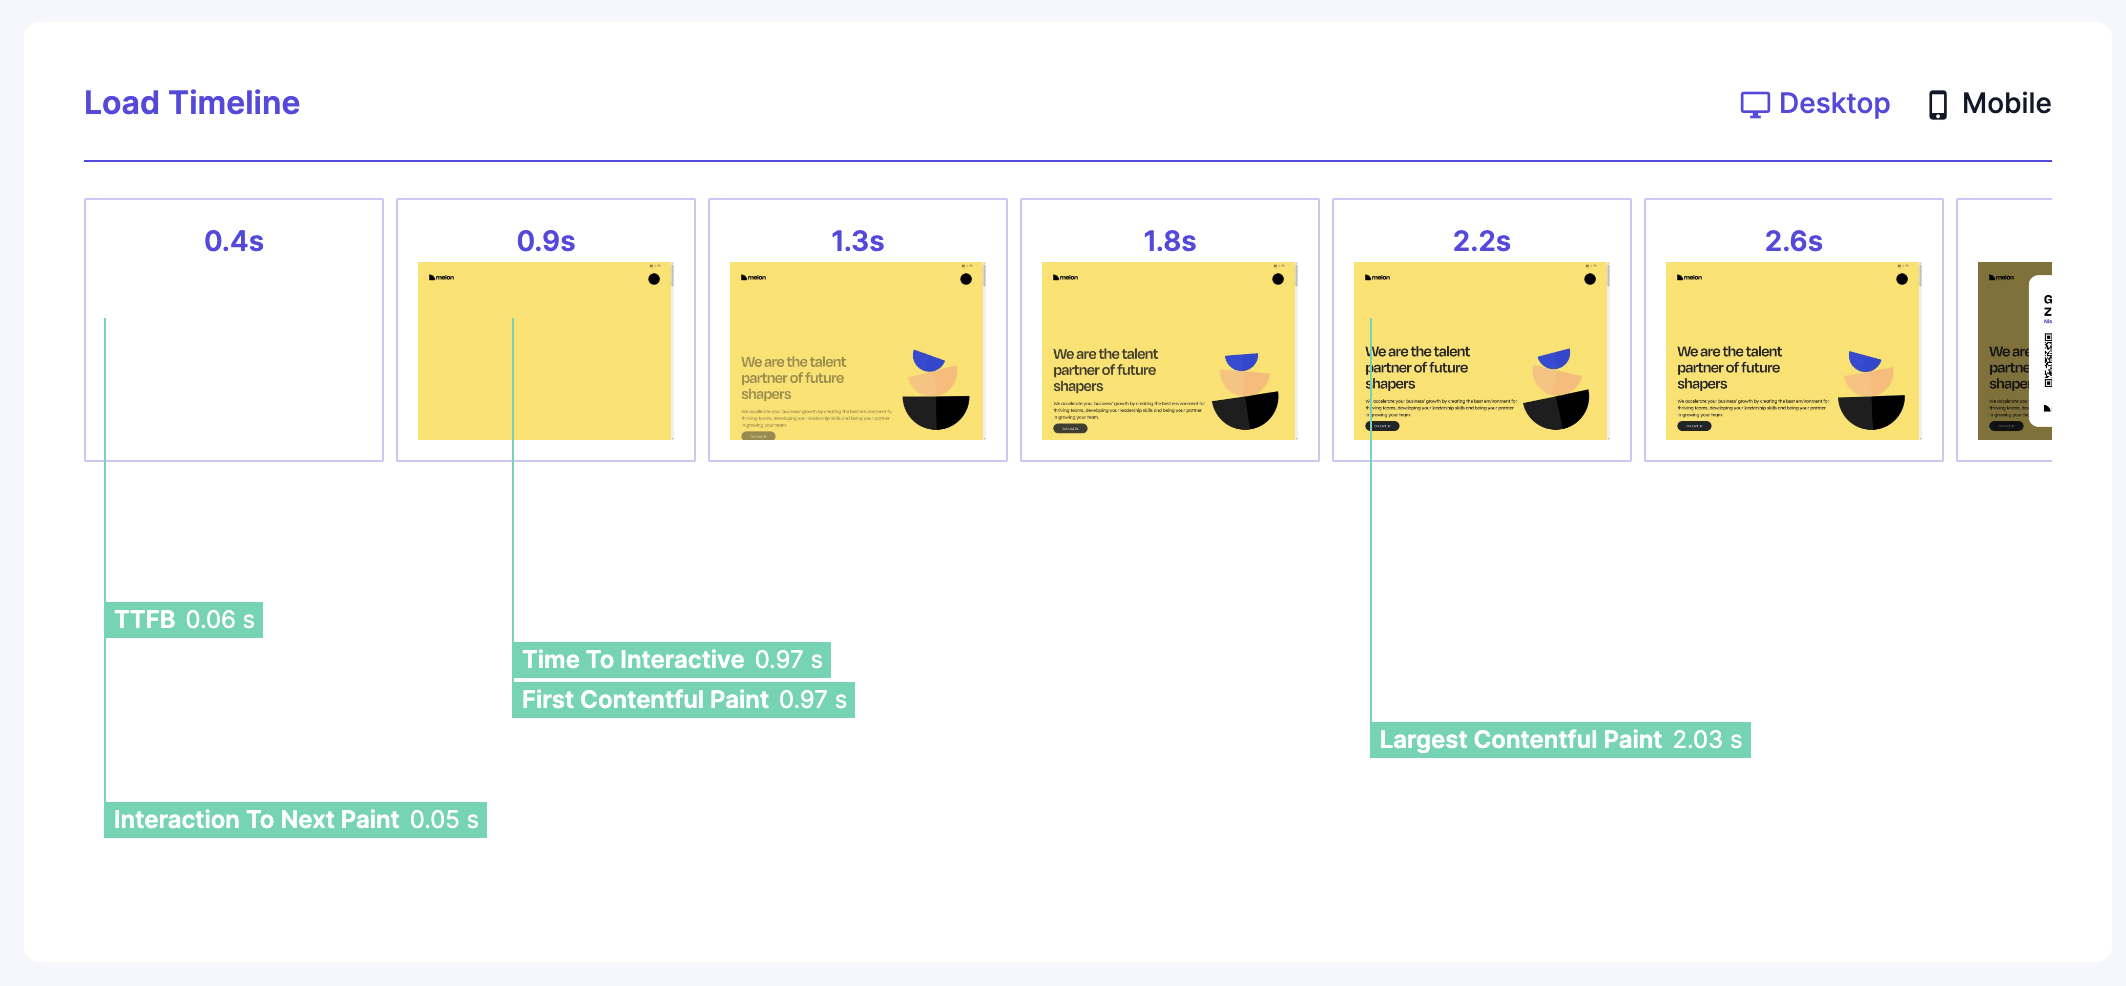
The first panel, Load Timeline, provides a visual and interactive timeline featuring screenshots captured at each critical moment during your page’s loading process. This feature allows you to visually track the progression of your page load from initiation to full availability. By examining these screenshots, you can pinpoint the exact stages where delays occur, providing a clear view of when your website starts to respond and when key elements become visible to the visitor.
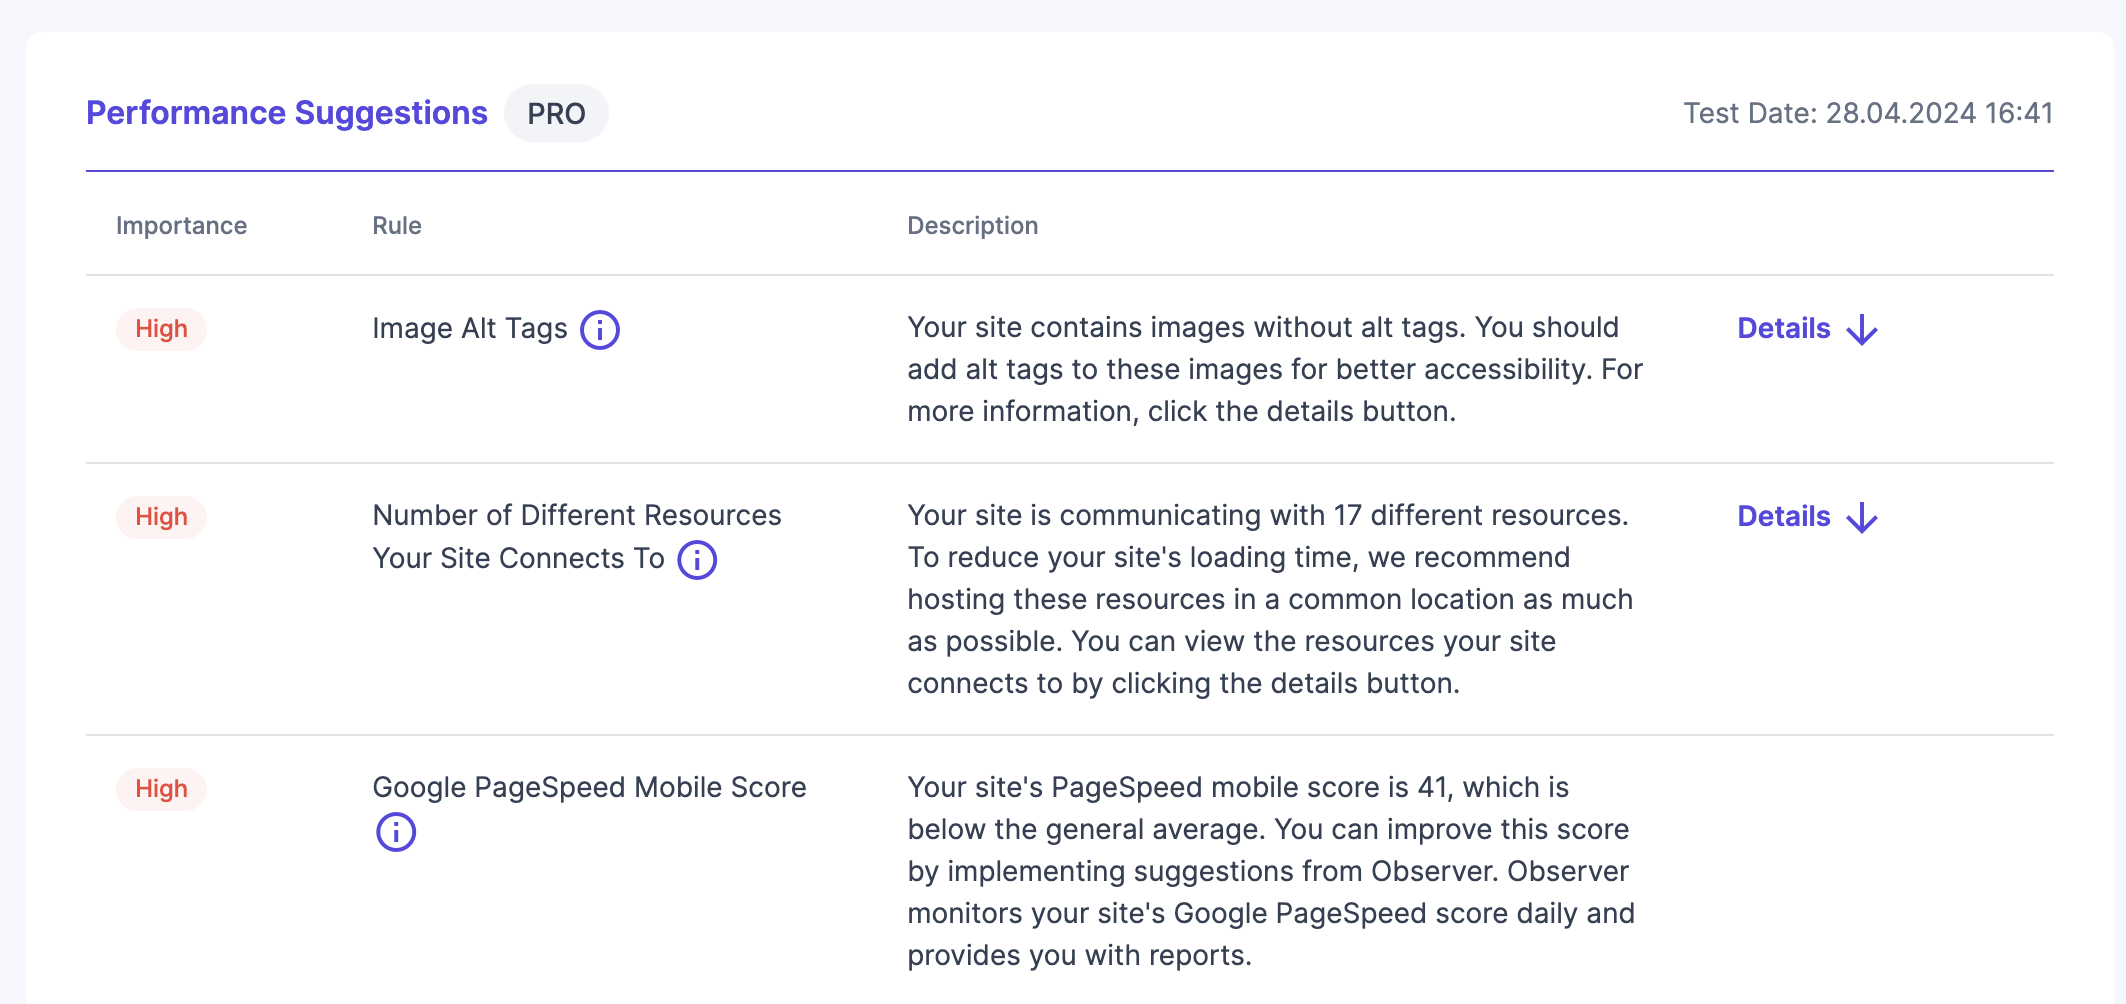
Moving on, the Performance Suggestions panel offers tailored advice to improve your website’s performance. Unlike standard automated recommendations, Observer’s suggestions are deeply contextual, linking directly to the specific portions of your code that could benefit from optimization. Each suggestion comes with a detailed explanation of what the issue is, how addressing it could impact your site, and its priority level. This targeted guidance helps you make informed decisions about where to focus your optimization efforts for maximum impact.
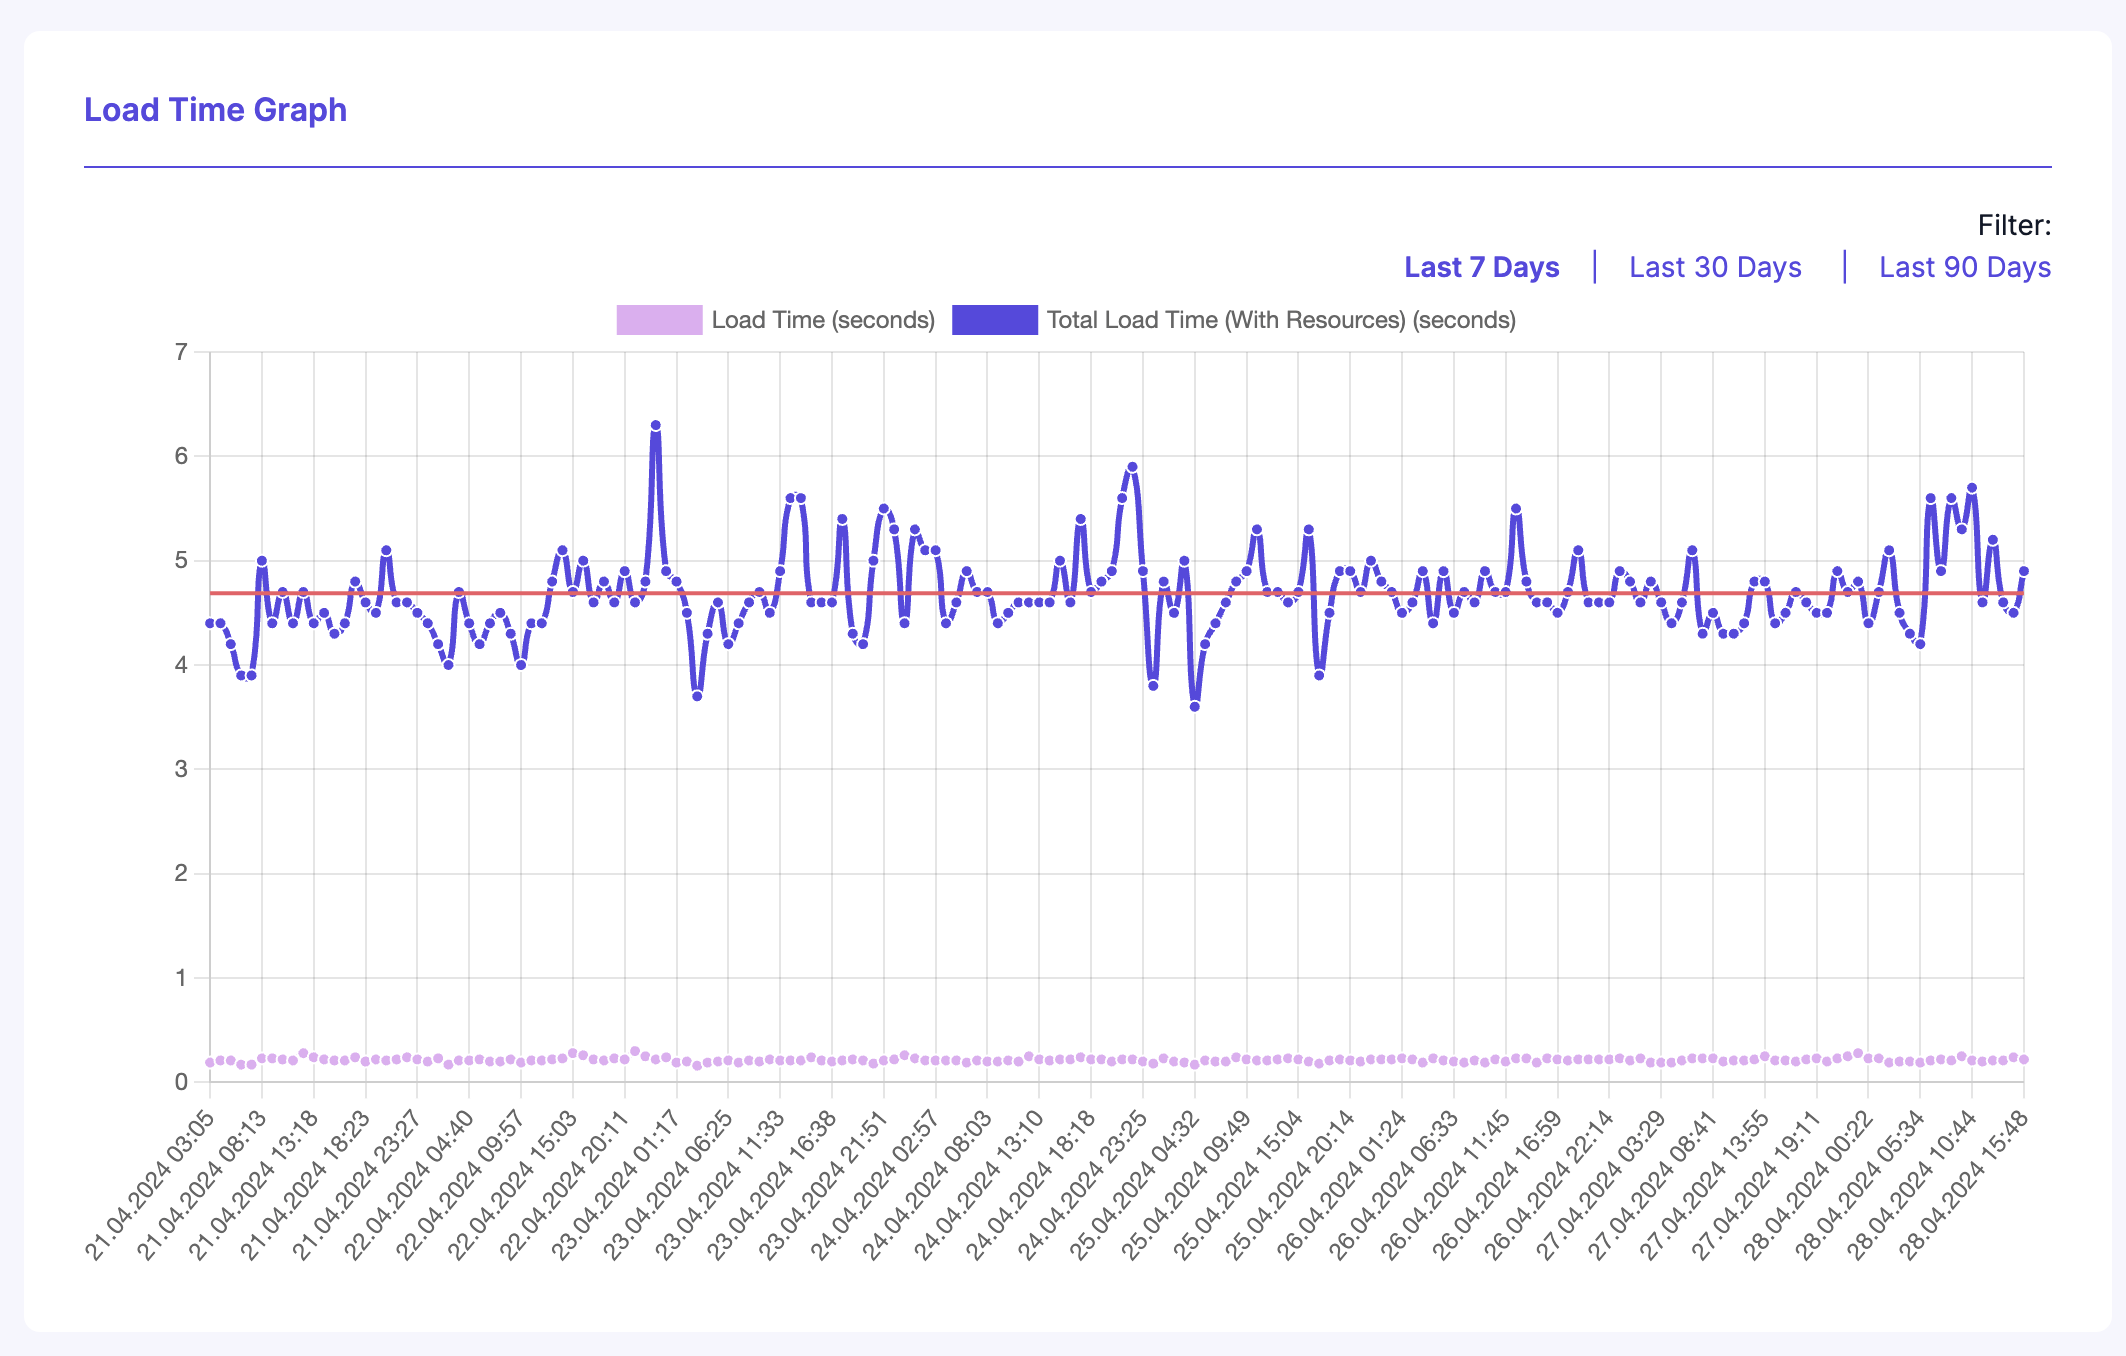
Lastly, the Load Time Graph presents a dual-line chart that tracks the loading times of your website on an hourly basis. One line represents the initial response time of your homepage—essentially how quickly the server starts delivering content upon request. The other line measures the total load time, accounting for all the resources required to fully display your homepage. This graph is crucial for understanding the overall timing dynamics of your site and for identifying times of day when performance may dip due to increased traffic or server issues.
Together, these panels provide a robust toolkit within the Performance section, offering both detailed diagnostics and actionable insights to help maintain and enhance the speed and responsiveness of your website.
Domain
The Domain section of the Observer Dashboard provides essential tools to manage and monitor your domain-related information effectively, divided into two key panels.
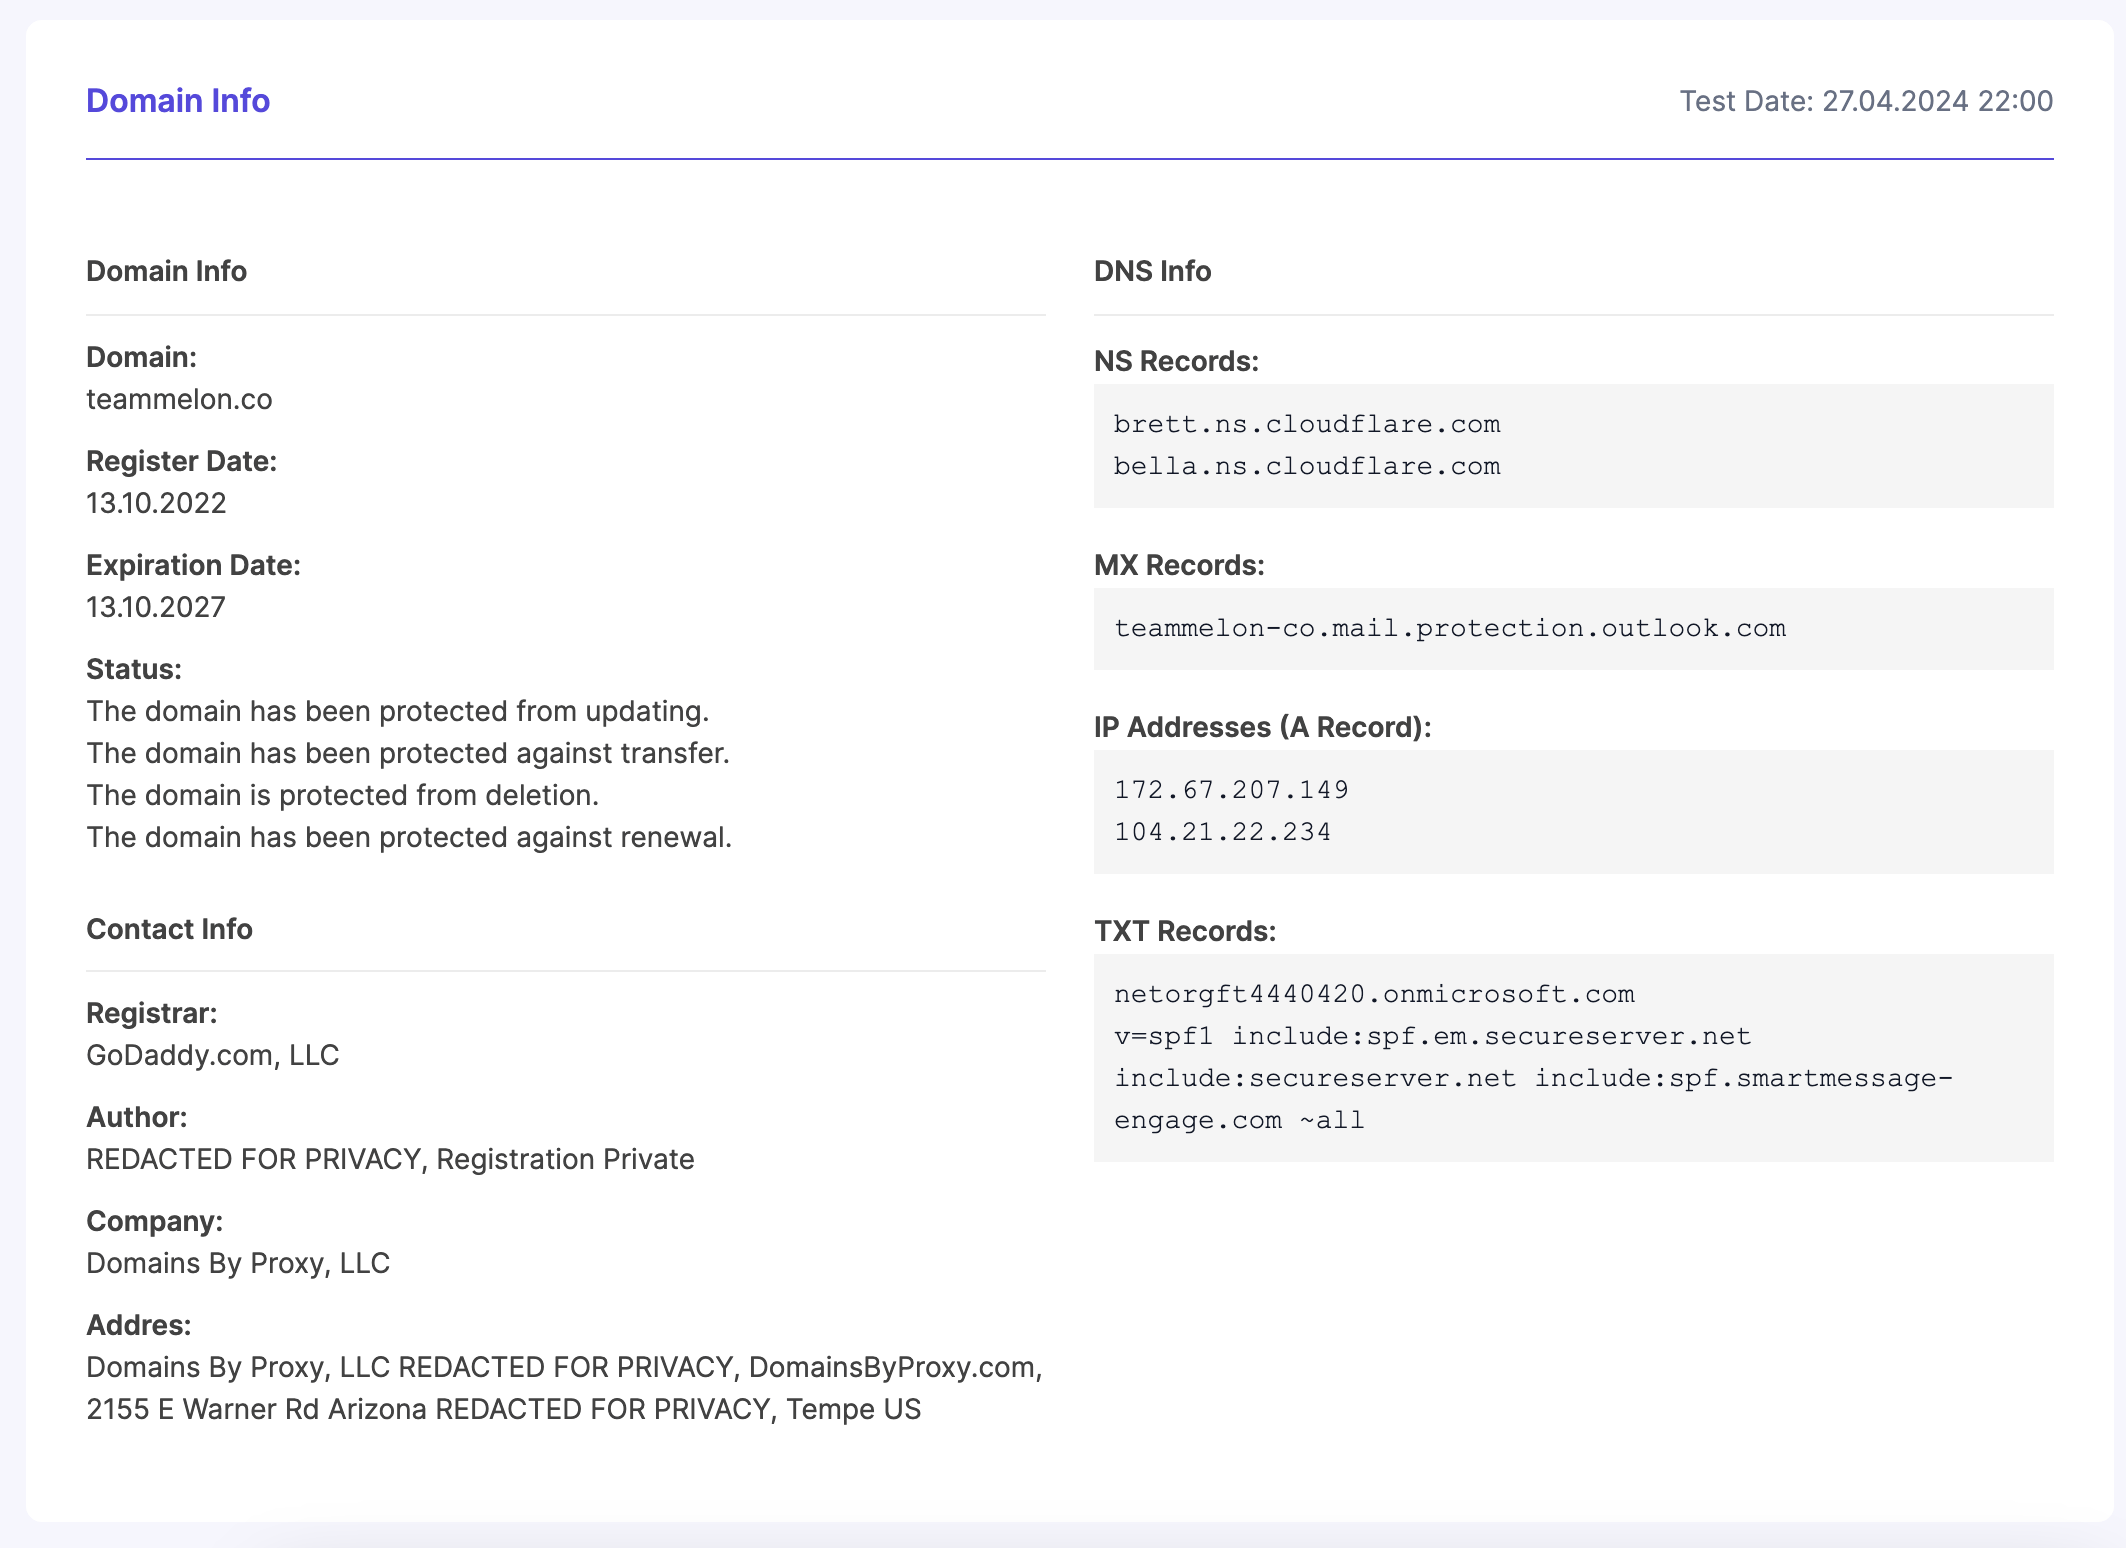
The first panel, Domain Info, serves as a central hub for all your domain’s critical details. It displays information such as your current registrar, the complete WHOIS data, and all the active NS/DNS records associated with your domain. This comprehensive overview allows you to quickly verify the accuracy of your domain information and ensure that all settings are correctly configured for optimal website operation. Having quick access to such details is invaluable for maintaining security and ensuring that your domain’s setup supports your website’s needs.
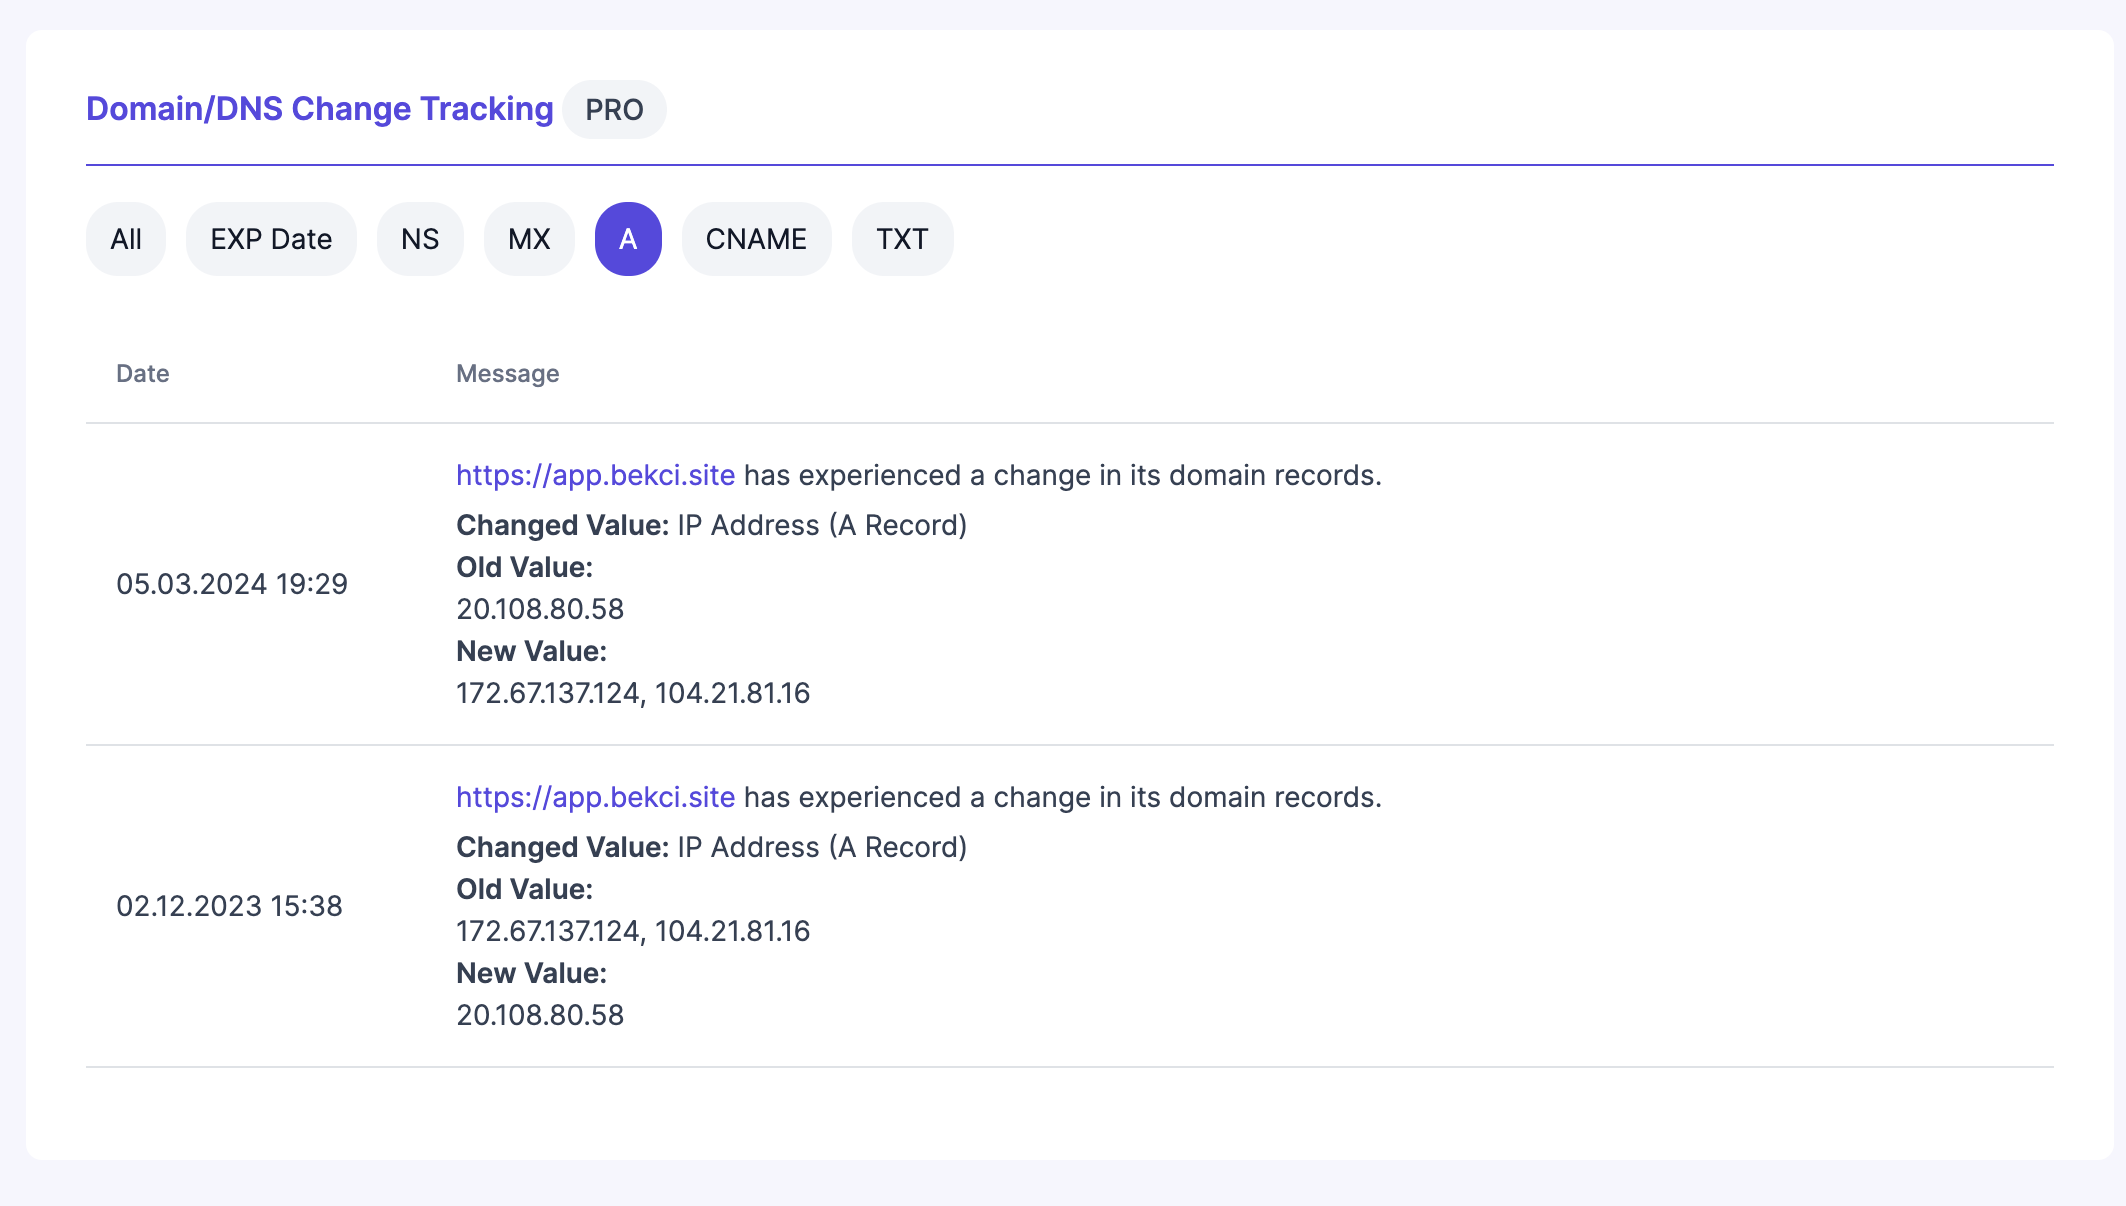
The second panel, Domain/DNS Change Tracking, is particularly vital for maintaining the integrity and stability of your website. This panel logs every modification made to your DNS records, presenting a detailed history of changes. Each entry in the logbook includes the date, the specific change made, and other relevant details. This historical record is crucial for troubleshooting issues related to domain configurations and for auditing purposes. Moreover, Observer enhances the utility of this panel by providing instant notifications whenever a change is detected. These alerts ensure that you are always aware of modifications—whether they are authorized or malicious—allowing you to respond swiftly to secure your domain and maintain continuous website availability.
Together, these panels not only help you keep a vigilant eye on your domain’s status and history but also empower you with the information necessary to act quickly in the event of unauthorized changes, thereby safeguarding your online presence.
Google Pagespeed
In the Google Pagespeed section of the Observer Dashboard, users gain a direct line of sight into the performance metrics that Google considers crucial for a good user experience. This section is designed to help you understand and optimize your website’s responsiveness and loading efficiency as measured by Google’s standards.
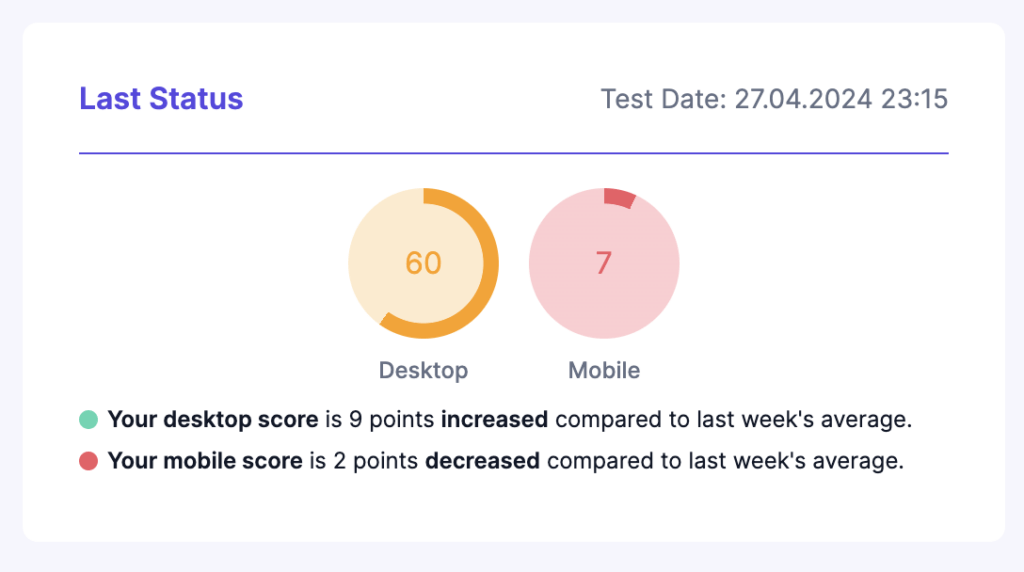
At the top of this section, you’ll find the most recent Google Pagespeed scores for your homepage, provided separately for mobile and desktop versions. These scores are critical as they reflect how well your site performs on varying devices, a key factor in both user satisfaction and search engine ranking. Keeping an eye on these scores helps ensure that your site meets the best practices recommended by Google and offers an optimal experience for all users.
Below the latest scores, the section expands into a detailed chart that tracks the daily history of your Google Pagespeed scores. This visualization is not just a snapshot of overall performance over time but also includes breakdowns of individual metrics such as Time to First Byte (TTFB), First Contentful Paint (FCP), Largest Contentful Paint (LCP), Cumulative Layout Shift (CLS), Speed Index, and Interaction to Next Paint (INP). Each of these elements plays a significant role in how Google assesses the performance of your site, and understanding their trends can guide targeted improvements.
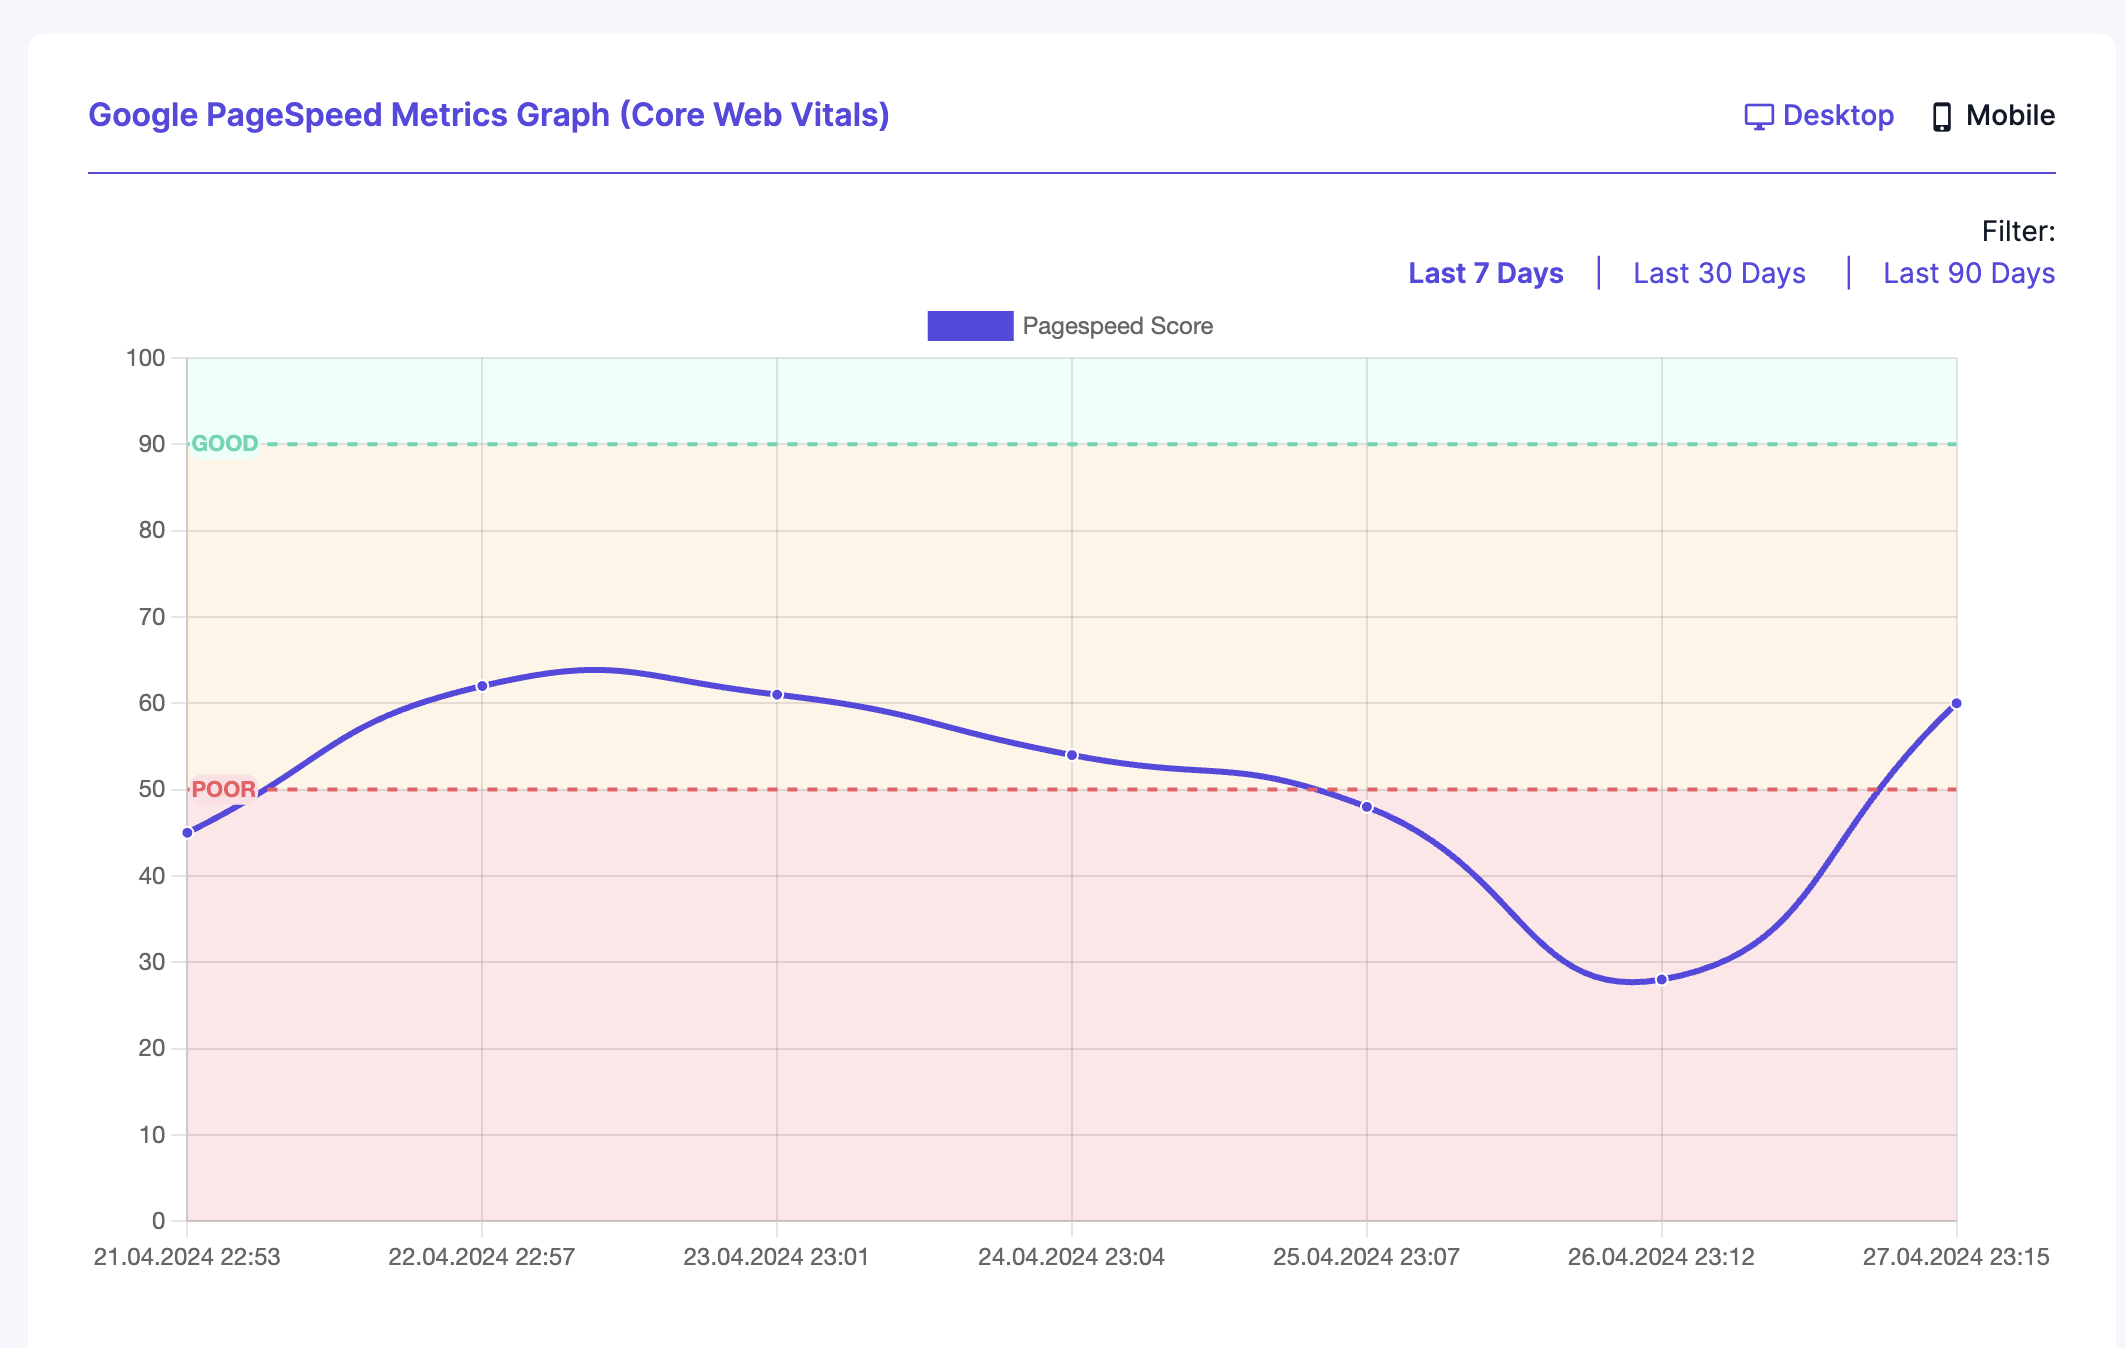
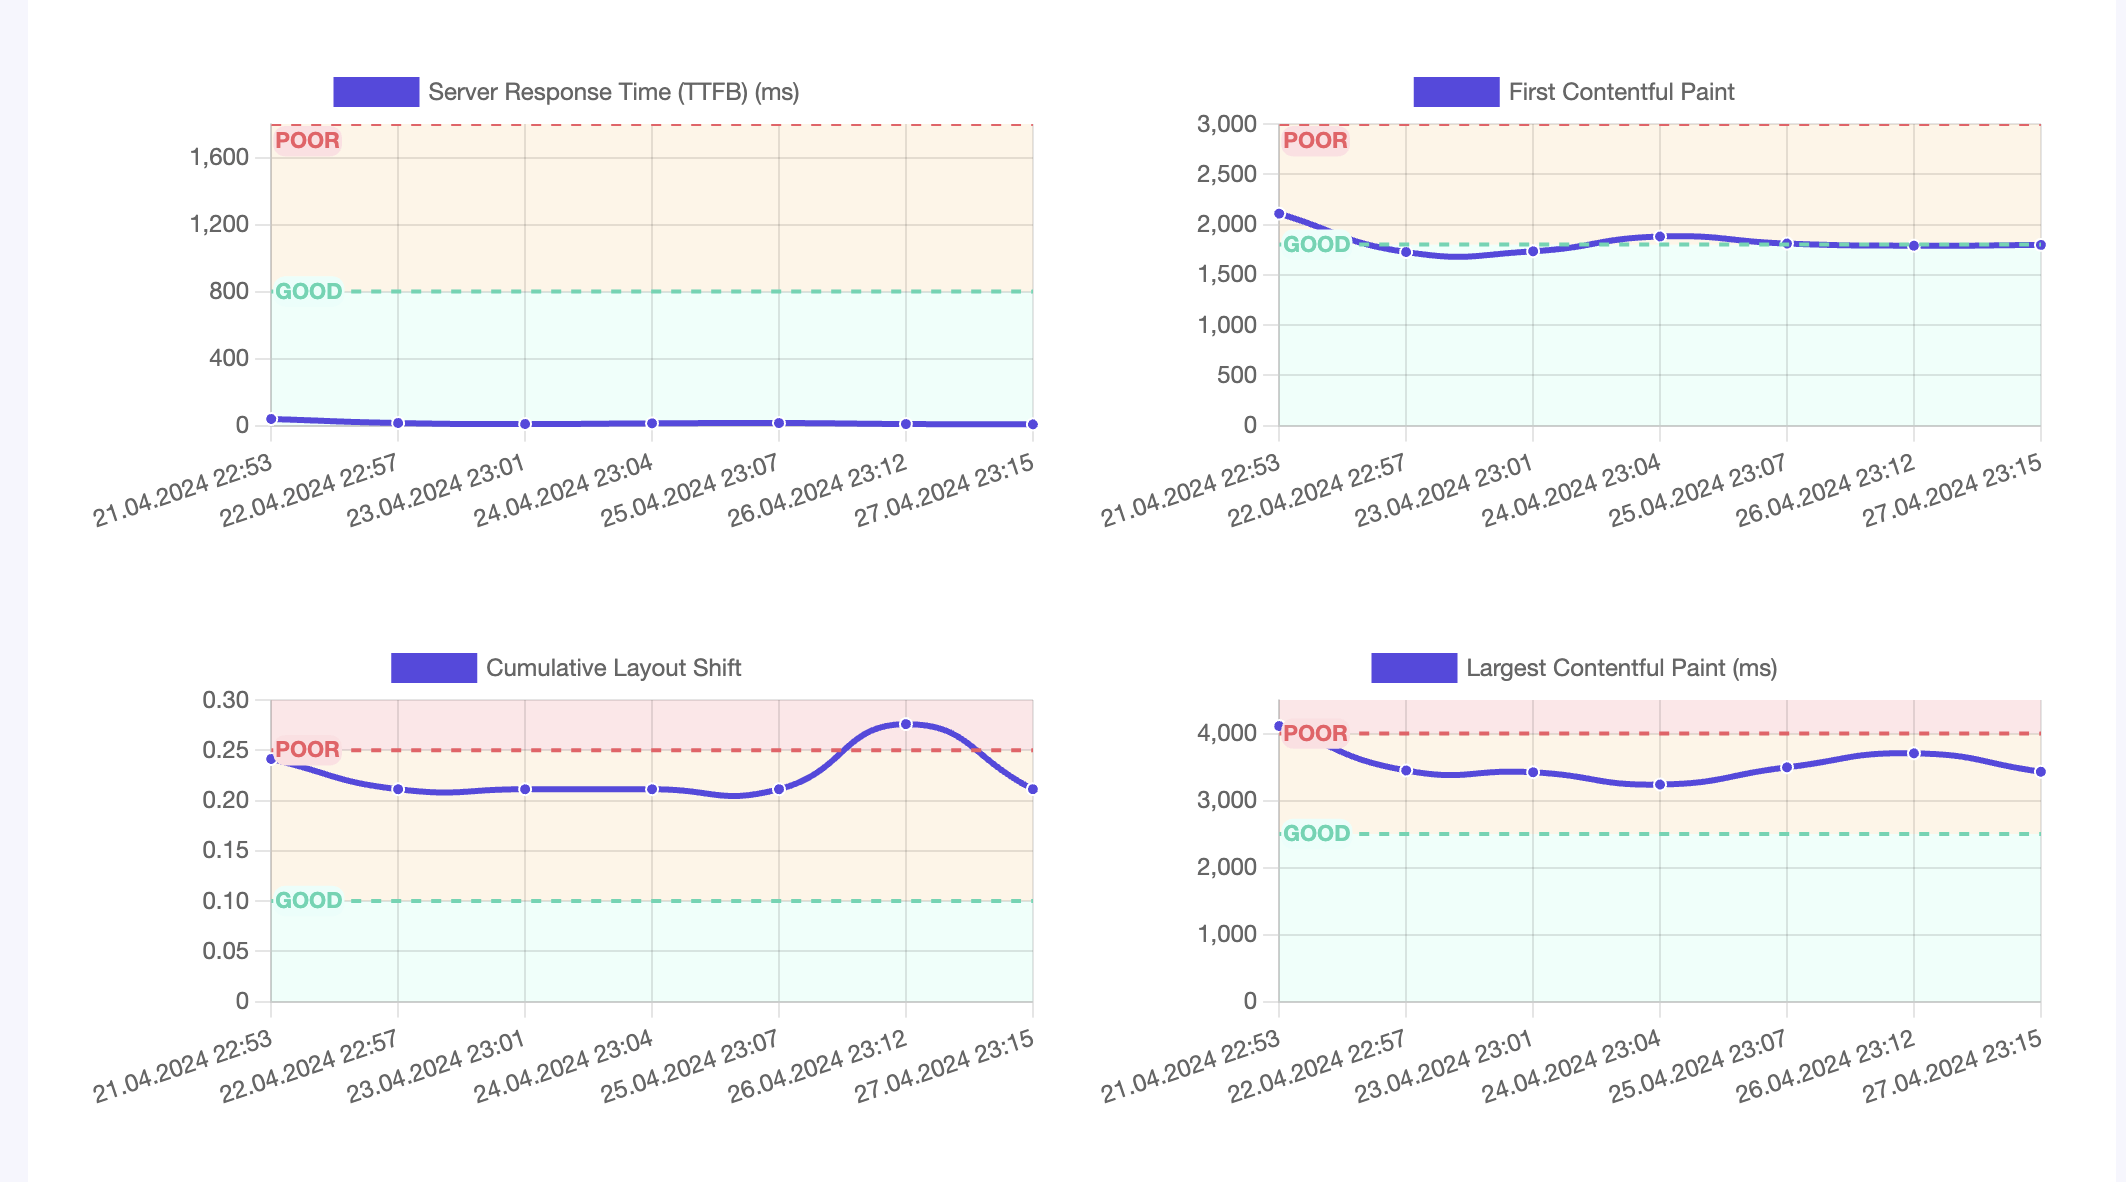
The chart is color-coded with three distinct background zones—green, yellow, and red—each representing different performance levels. A green background indicates good performance scores, suggesting that your website meets or exceeds Google’s performance benchmarks. Yellow signifies average scores, where there is room for improvement, and red denotes poor performance, highlighting critical areas that need immediate attention to avoid negatively impacting user experience and SEO rankings.
This section is invaluable for continuously monitoring how updates to your site or changes to Google’s algorithms affect your Pagespeed scores. By regularly reviewing this data, you can proactively manage your site’s performance and make necessary adjustments to stay ahead in the competitive landscape of online search rankings.
Lighthouse
The Lighthouse section of the Observer Dashboard leverages Google’s Lighthouse tool, an open-source, automated tool designed to help developers improve the quality of their web pages by providing audits for performance, accessibility, progressive web apps, SEO, and more.
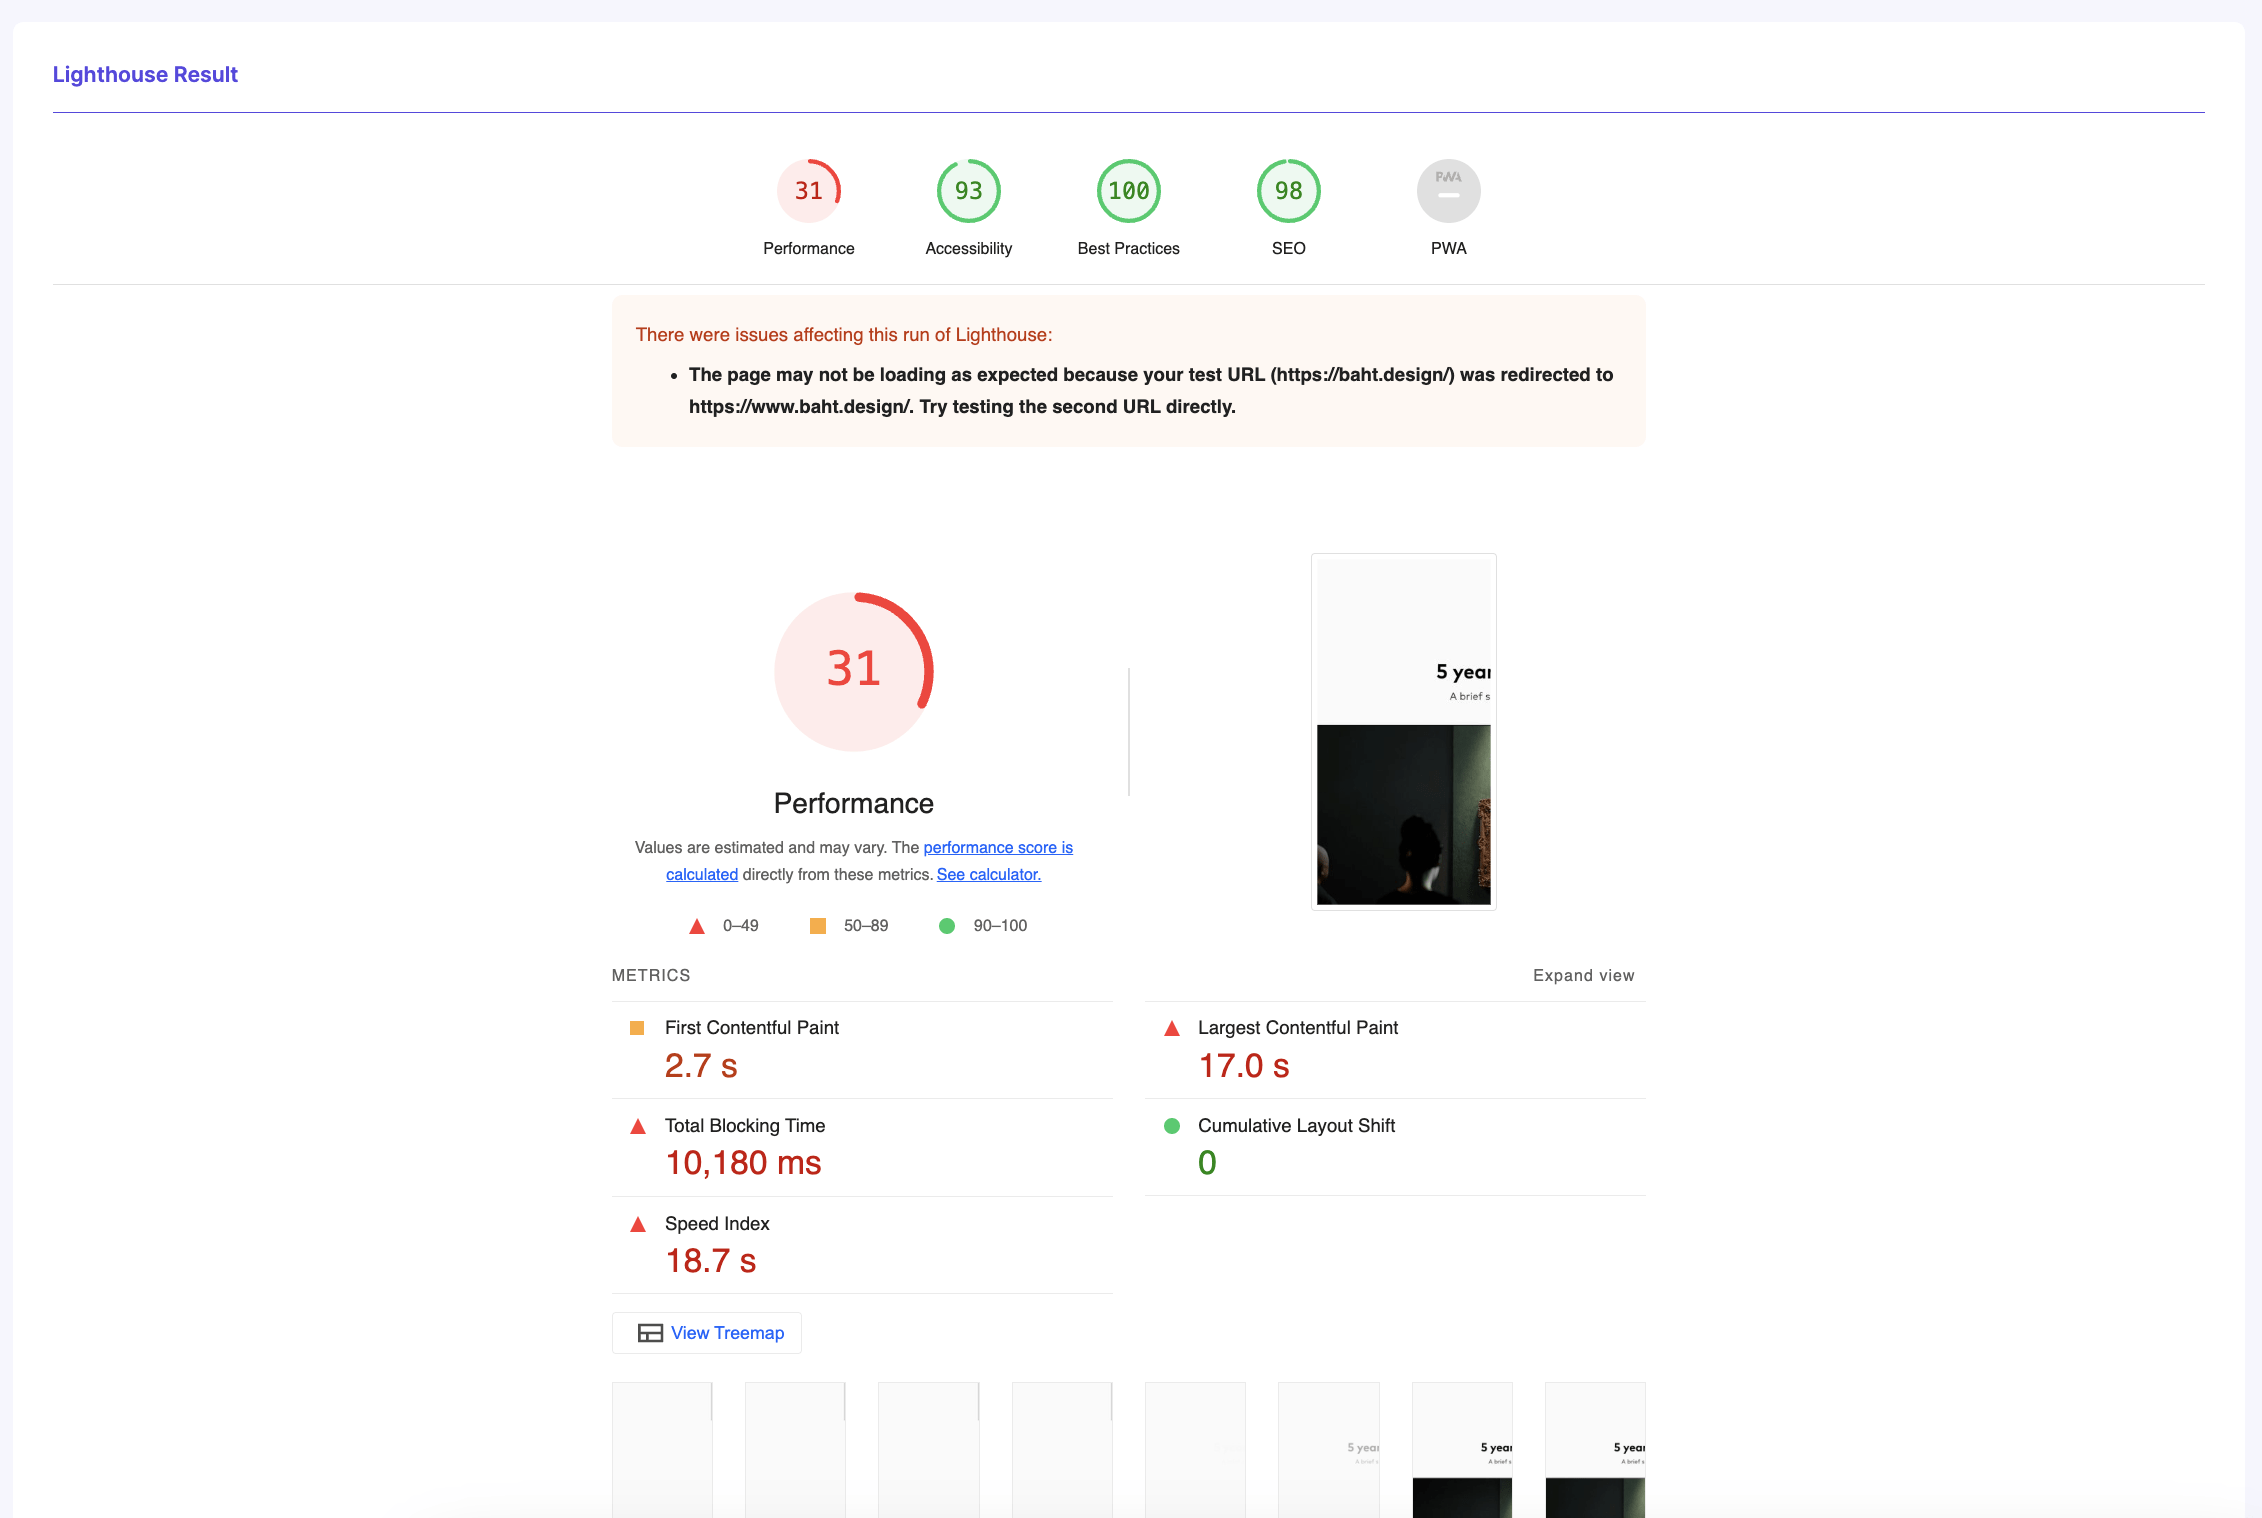
On this page, you can access the comprehensive Lighthouse results for your website, which include detailed scores across the various audits along with actionable suggestions for enhancements. These insights are invaluable for identifying opportunities to boost the efficiency and user-friendliness of your site, ensuring it meets the latest standards for a high-quality web presence.
Real User Data (Chrome UX Report)
The Real User Data section of the Observer Dashboard provides a crucial perspective on how actual visitors experience your website. Unlike simulated tests, this feature analyzes data from real user interactions, capturing diverse connection speeds and browsing conditions to give you a true sense of your site’s performance in the real world.
This section displays the performance data as percentages, categorizing how many of your users experience fast load times versus those who face suboptimal speeds. This segmentation allows you to gauge the effectiveness of your site across different user demographics and identify if certain segments are consistently experiencing poor performance. Such insights are invaluable for targeted optimizations, ensuring that you enhance areas of your site that will most improve user satisfaction and engagement.
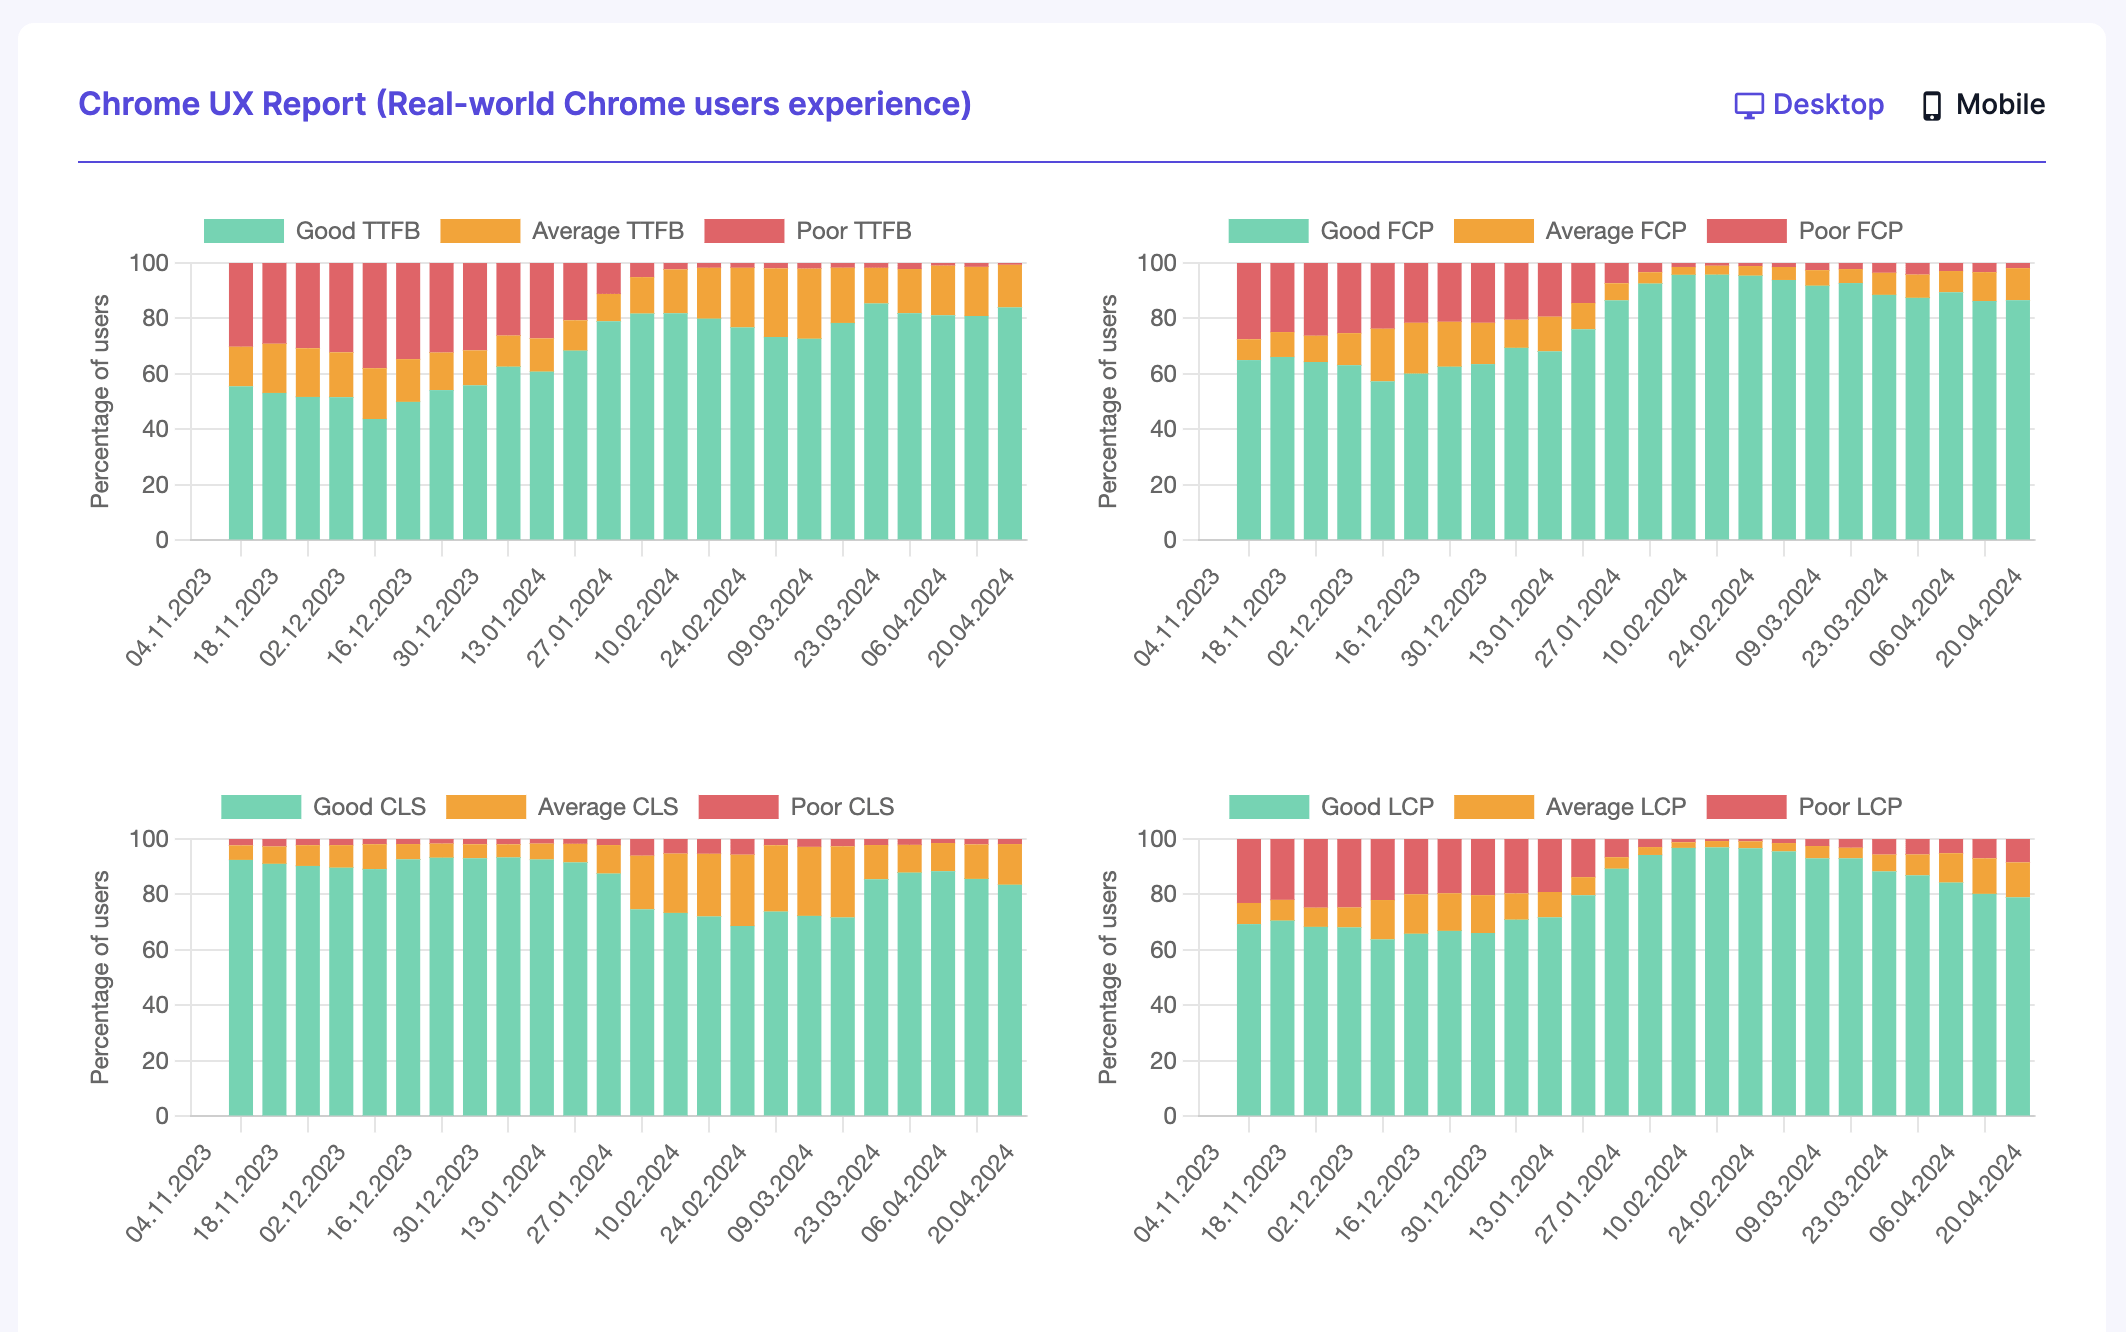
It’s important to note that the utility of this feature depends on your site having sufficient traffic. For websites with lower visitor numbers, the charts in the Real User Data section might be empty or show limited data. This dependency is due to the need for a robust data set to accurately reflect user experience trends and make statistically significant observations. Thus, as your site’s traffic grows, the insights from the Real User Data section will become increasingly valuable, offering a clearer and more comprehensive view of how real-world users interact with your site.
Resources
The Resources section of the Observer Dashboard is dedicated to providing detailed insights into the elements that make up your website, helping you understand and manage the resources that affect its performance. This section is divided into two panels, each offering a different perspective on how resources are handled during page loads.
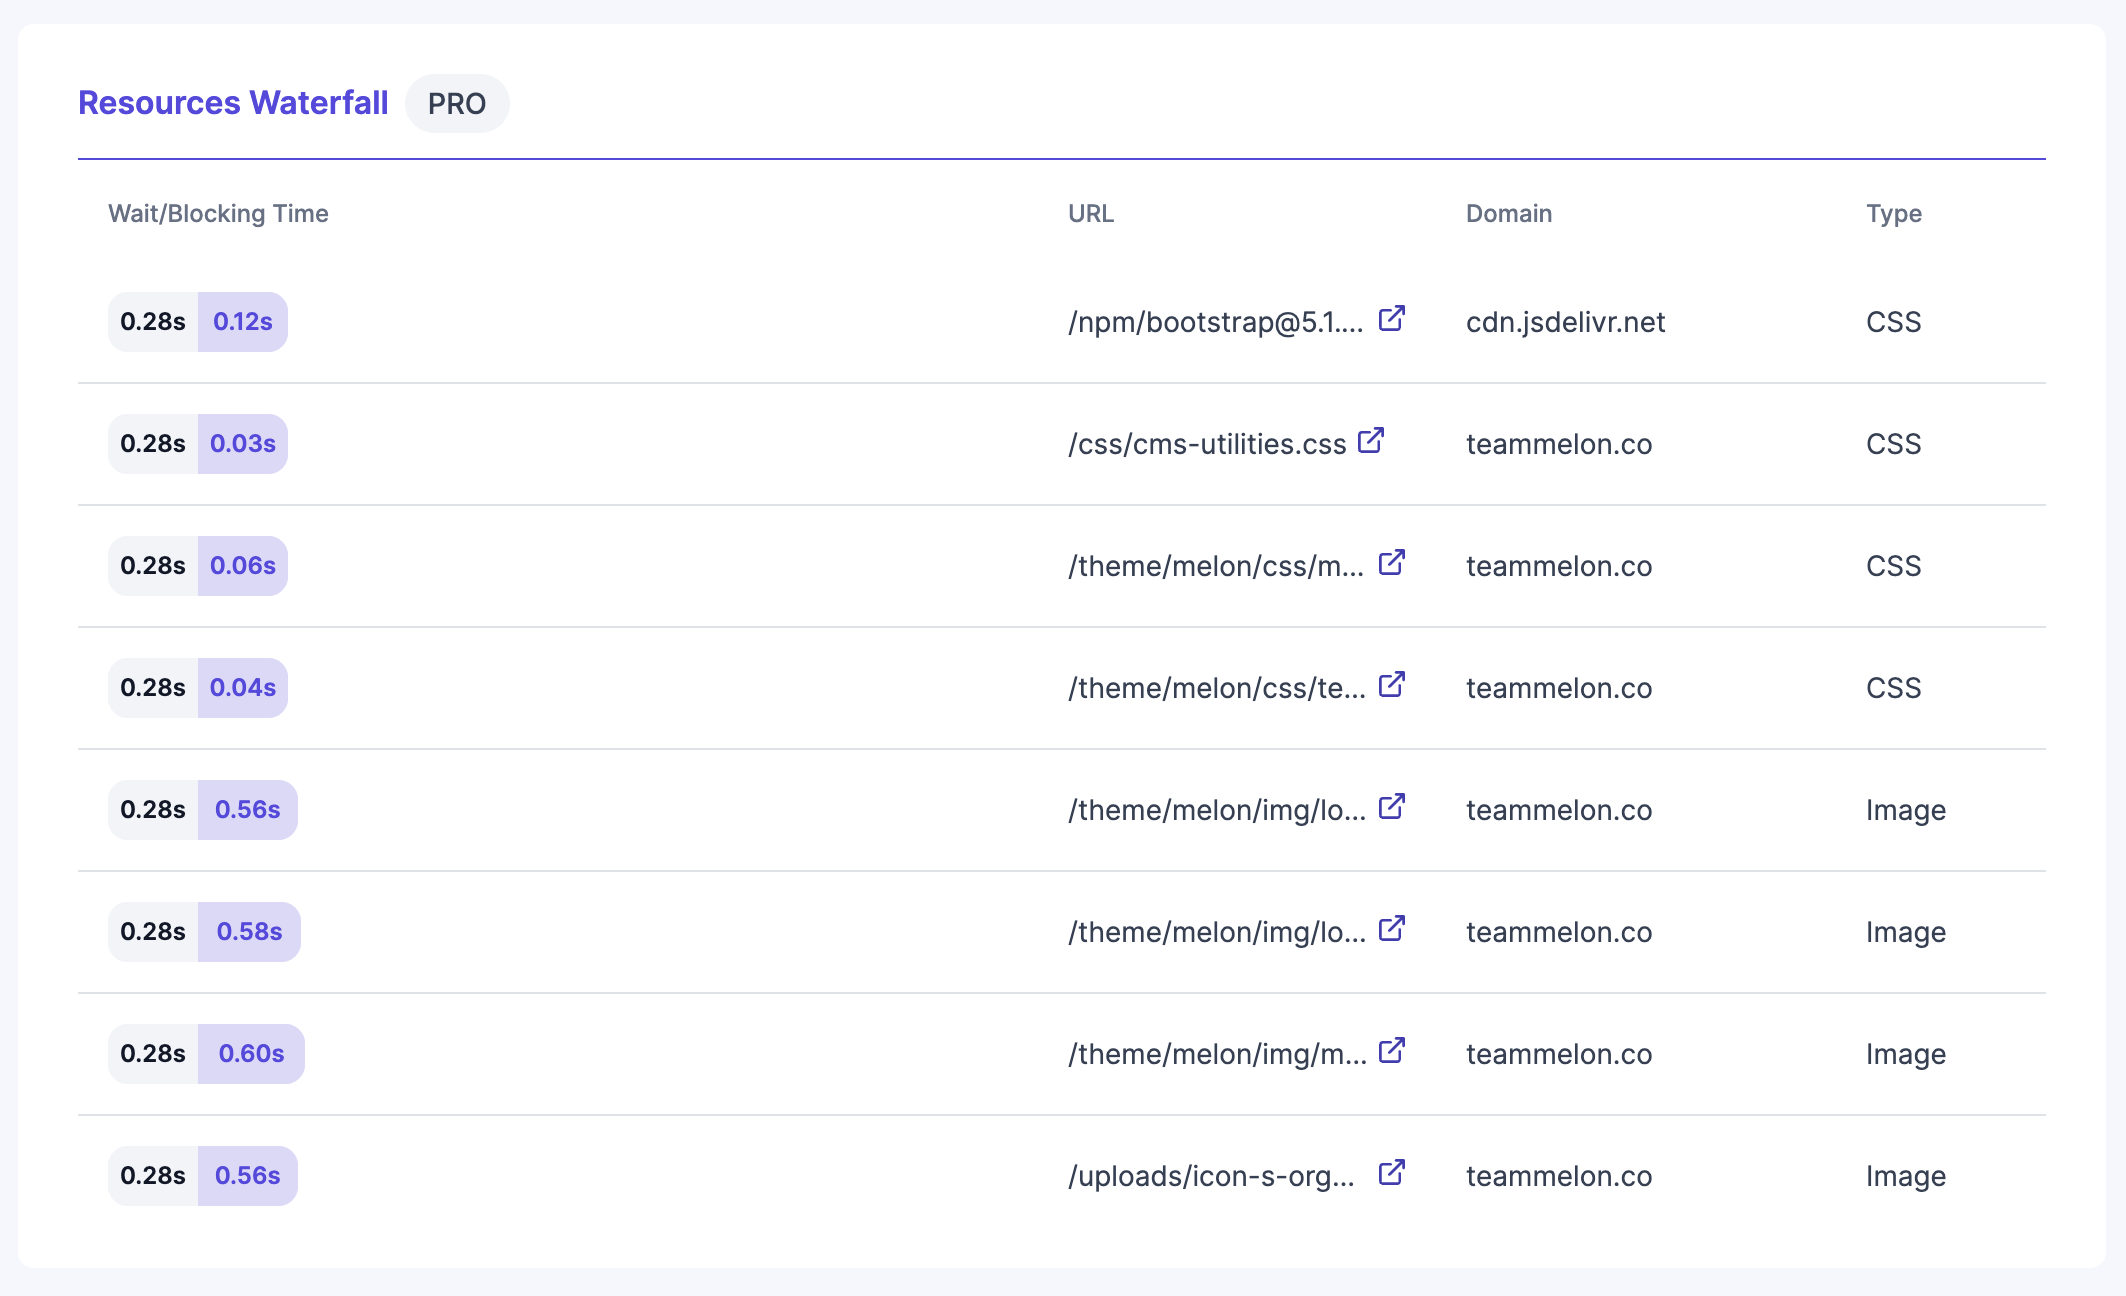
The first panel, Resources Waterfall, presents a detailed visualization of all the resources your webpage loads. This includes a breakdown of each resource’s size, the time it takes to load, and any time spent waiting (blocking time). The waterfall format of this panel is especially useful for identifying bottlenecks in the loading process, as it clearly shows the sequence and duration of resource loads. By analyzing this data, you can pinpoint specific files or scripts that may be causing delays and strategically optimize or replace them to improve overall loading efficiency.
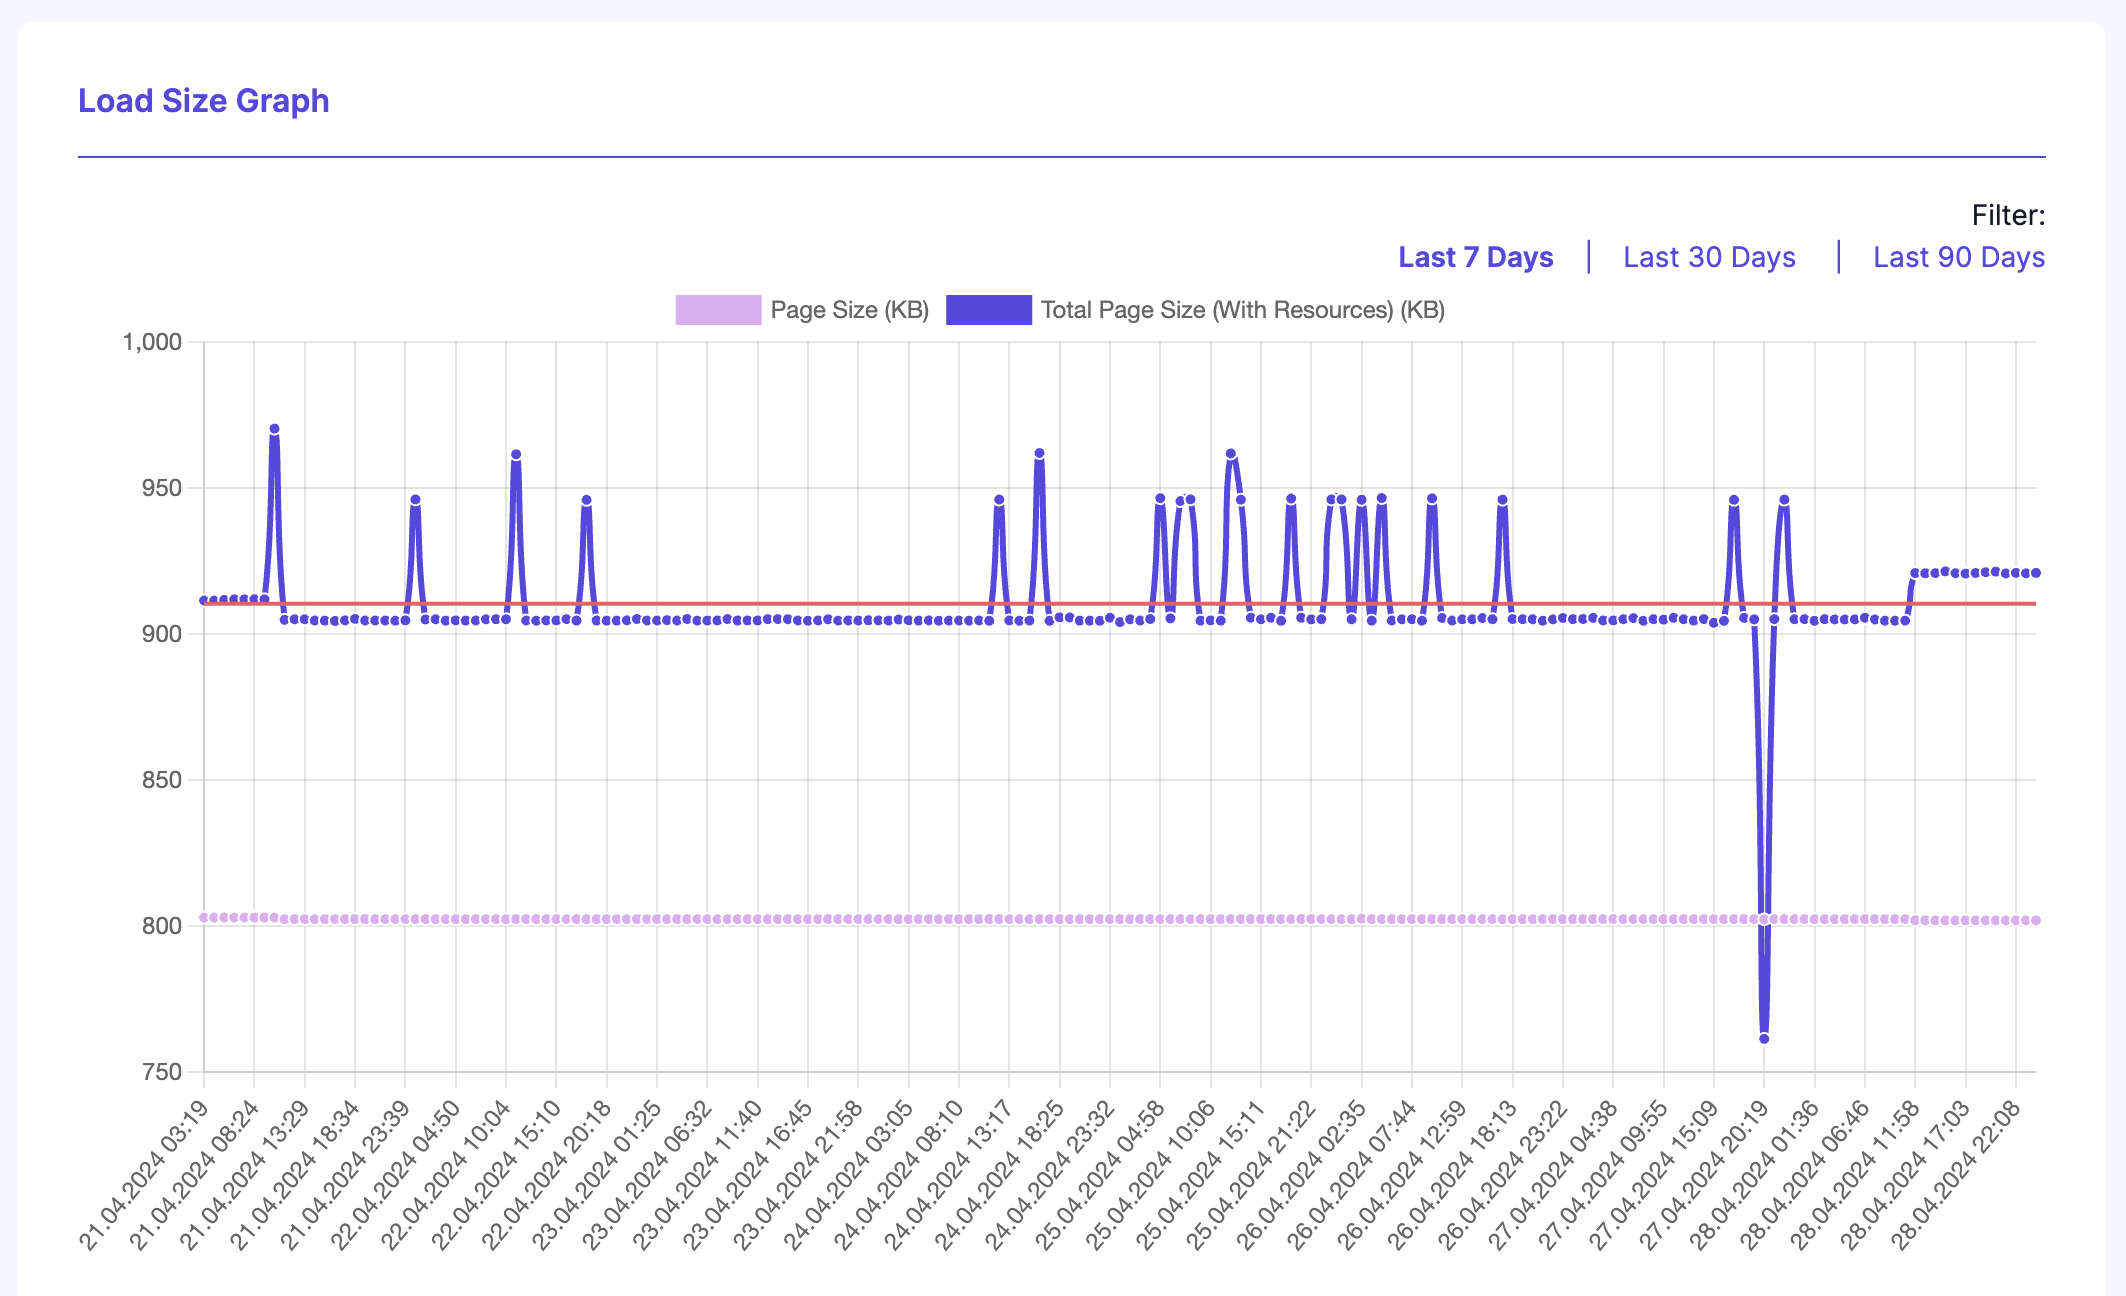
Adjacent to the Resources Waterfall is the Load Size Graph. This panel provides a historical view of your webpage’s size on an hourly basis, displaying both the size of your homepage alone and the total page size when all resources are included. This graph is essential for tracking changes in page size over time, which can be particularly useful after updates, optimizations, or content changes. By monitoring these trends, you can ensure that your page remains streamlined and efficient, avoiding the creep of resource bloat that can often occur with ongoing site development and maintenance.
Together, these panels in the Resources section offer a comprehensive toolkit for managing and optimizing the various elements that contribute to your site’s performance. By regularly reviewing this data, you can maintain a high-performing, responsive website that delivers a great user experience.
Console Logs
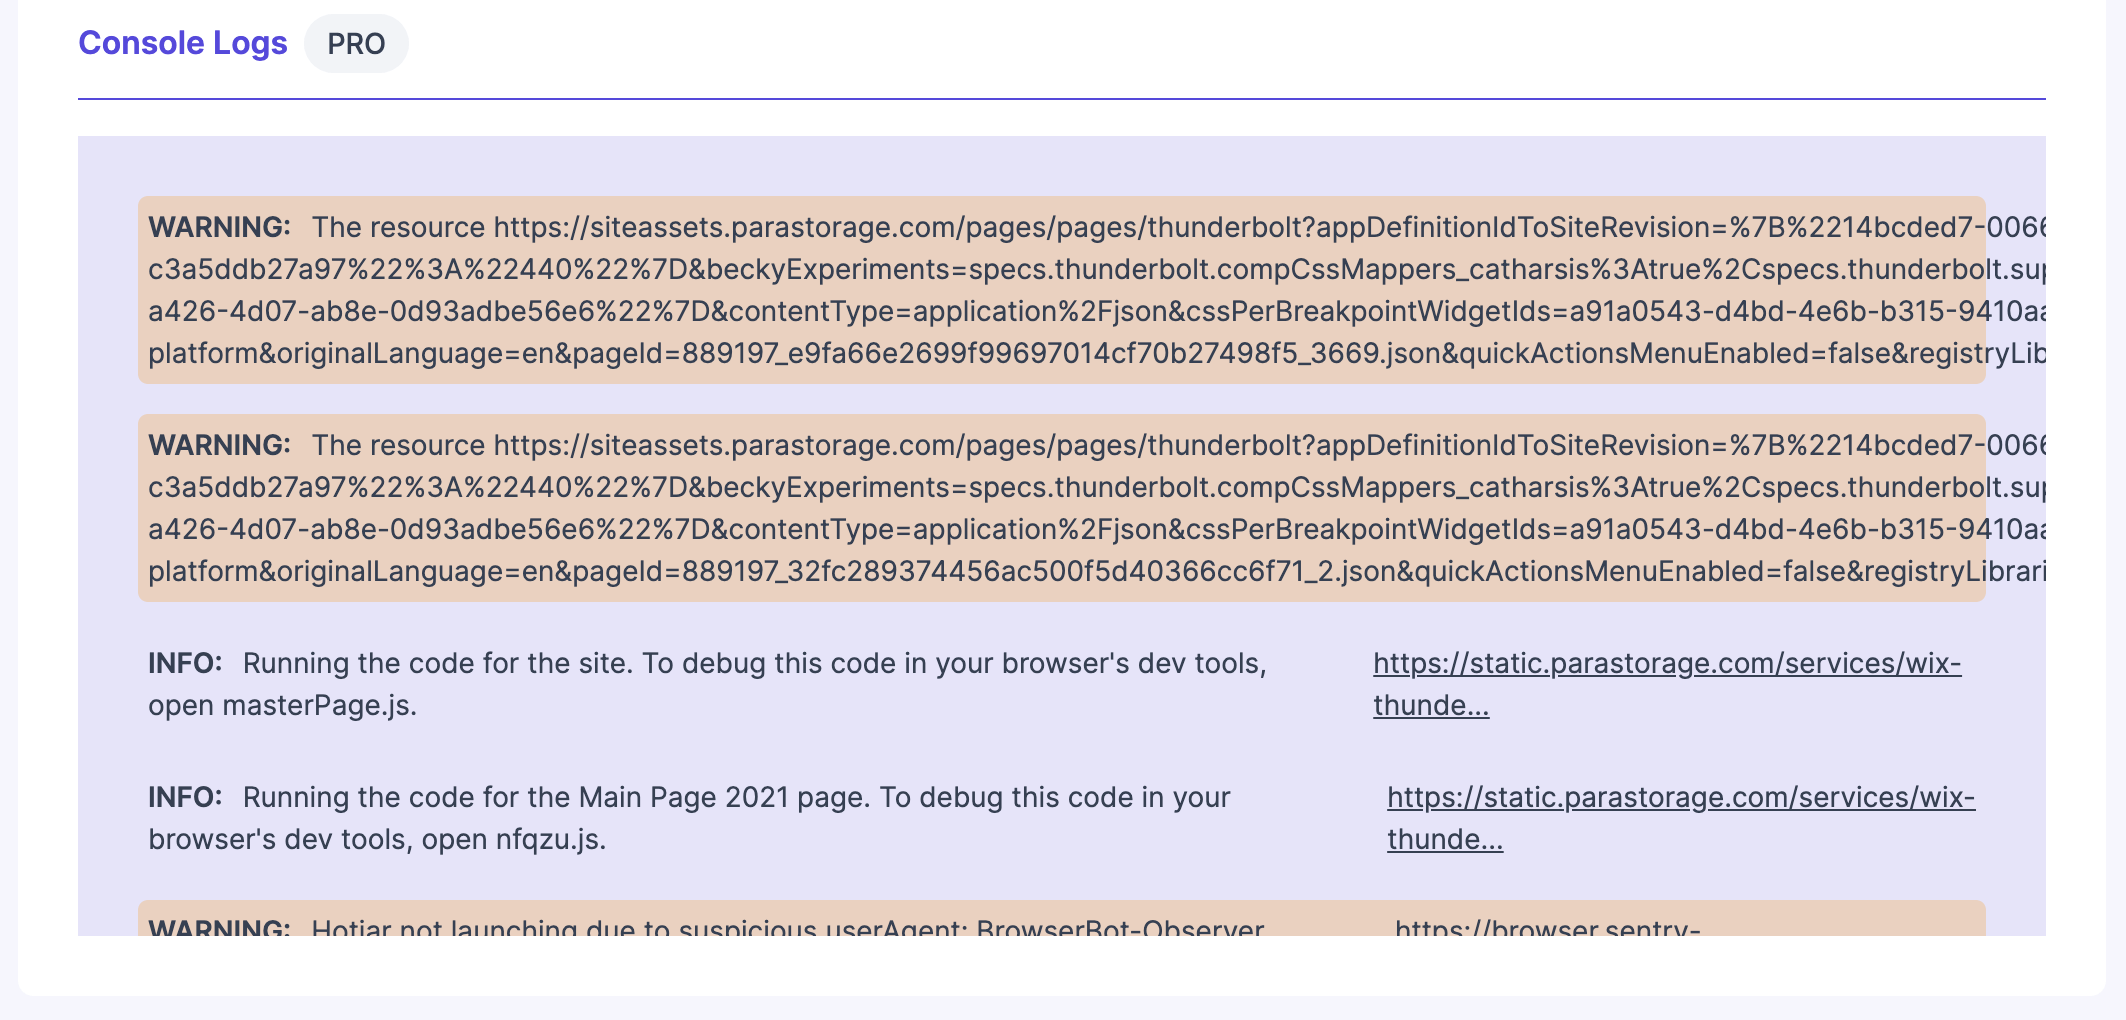
The Console Logs section of the Observer Dashboard serves as a crucial tool for developers and website administrators by providing a real-time and historical view of all console log messages. This comprehensive tracking of your website’s console activity includes everything from informational messages to warnings and critical errors.
Monitoring console logs is vital for maintaining the health and performance of your website. These logs can reveal issues that may not be immediately apparent through user feedback or other monitoring tools, such as JavaScript errors, security warnings, or deprecated functions that could affect user experience or site functionality. By having a centralized log of these messages, you can quickly identify new issues as they arise and address them before they impact your website’s performance or security.
Furthermore, Observer enhances the utility of this section by offering instant alerts. Whenever a new message, especially an error or warning, appears in the console, Observer notifies you immediately. This prompt alert system ensures that you can react swiftly to resolve issues, often before they escalate into more significant problems. This proactive approach to console log management helps maintain your site’s integrity and optimizes user experience by ensuring that potential setbacks are corrected swiftly and efficiently.
Performance History
The Performance History section of the Observer Dashboard provides a comprehensive archive of your website’s performance metrics, recorded daily. This valuable resource allows you to track historical data on various critical aspects such as Google Pagespeed scores, console log entries, resource usage, load times, page sizes, and Lighthouse results.
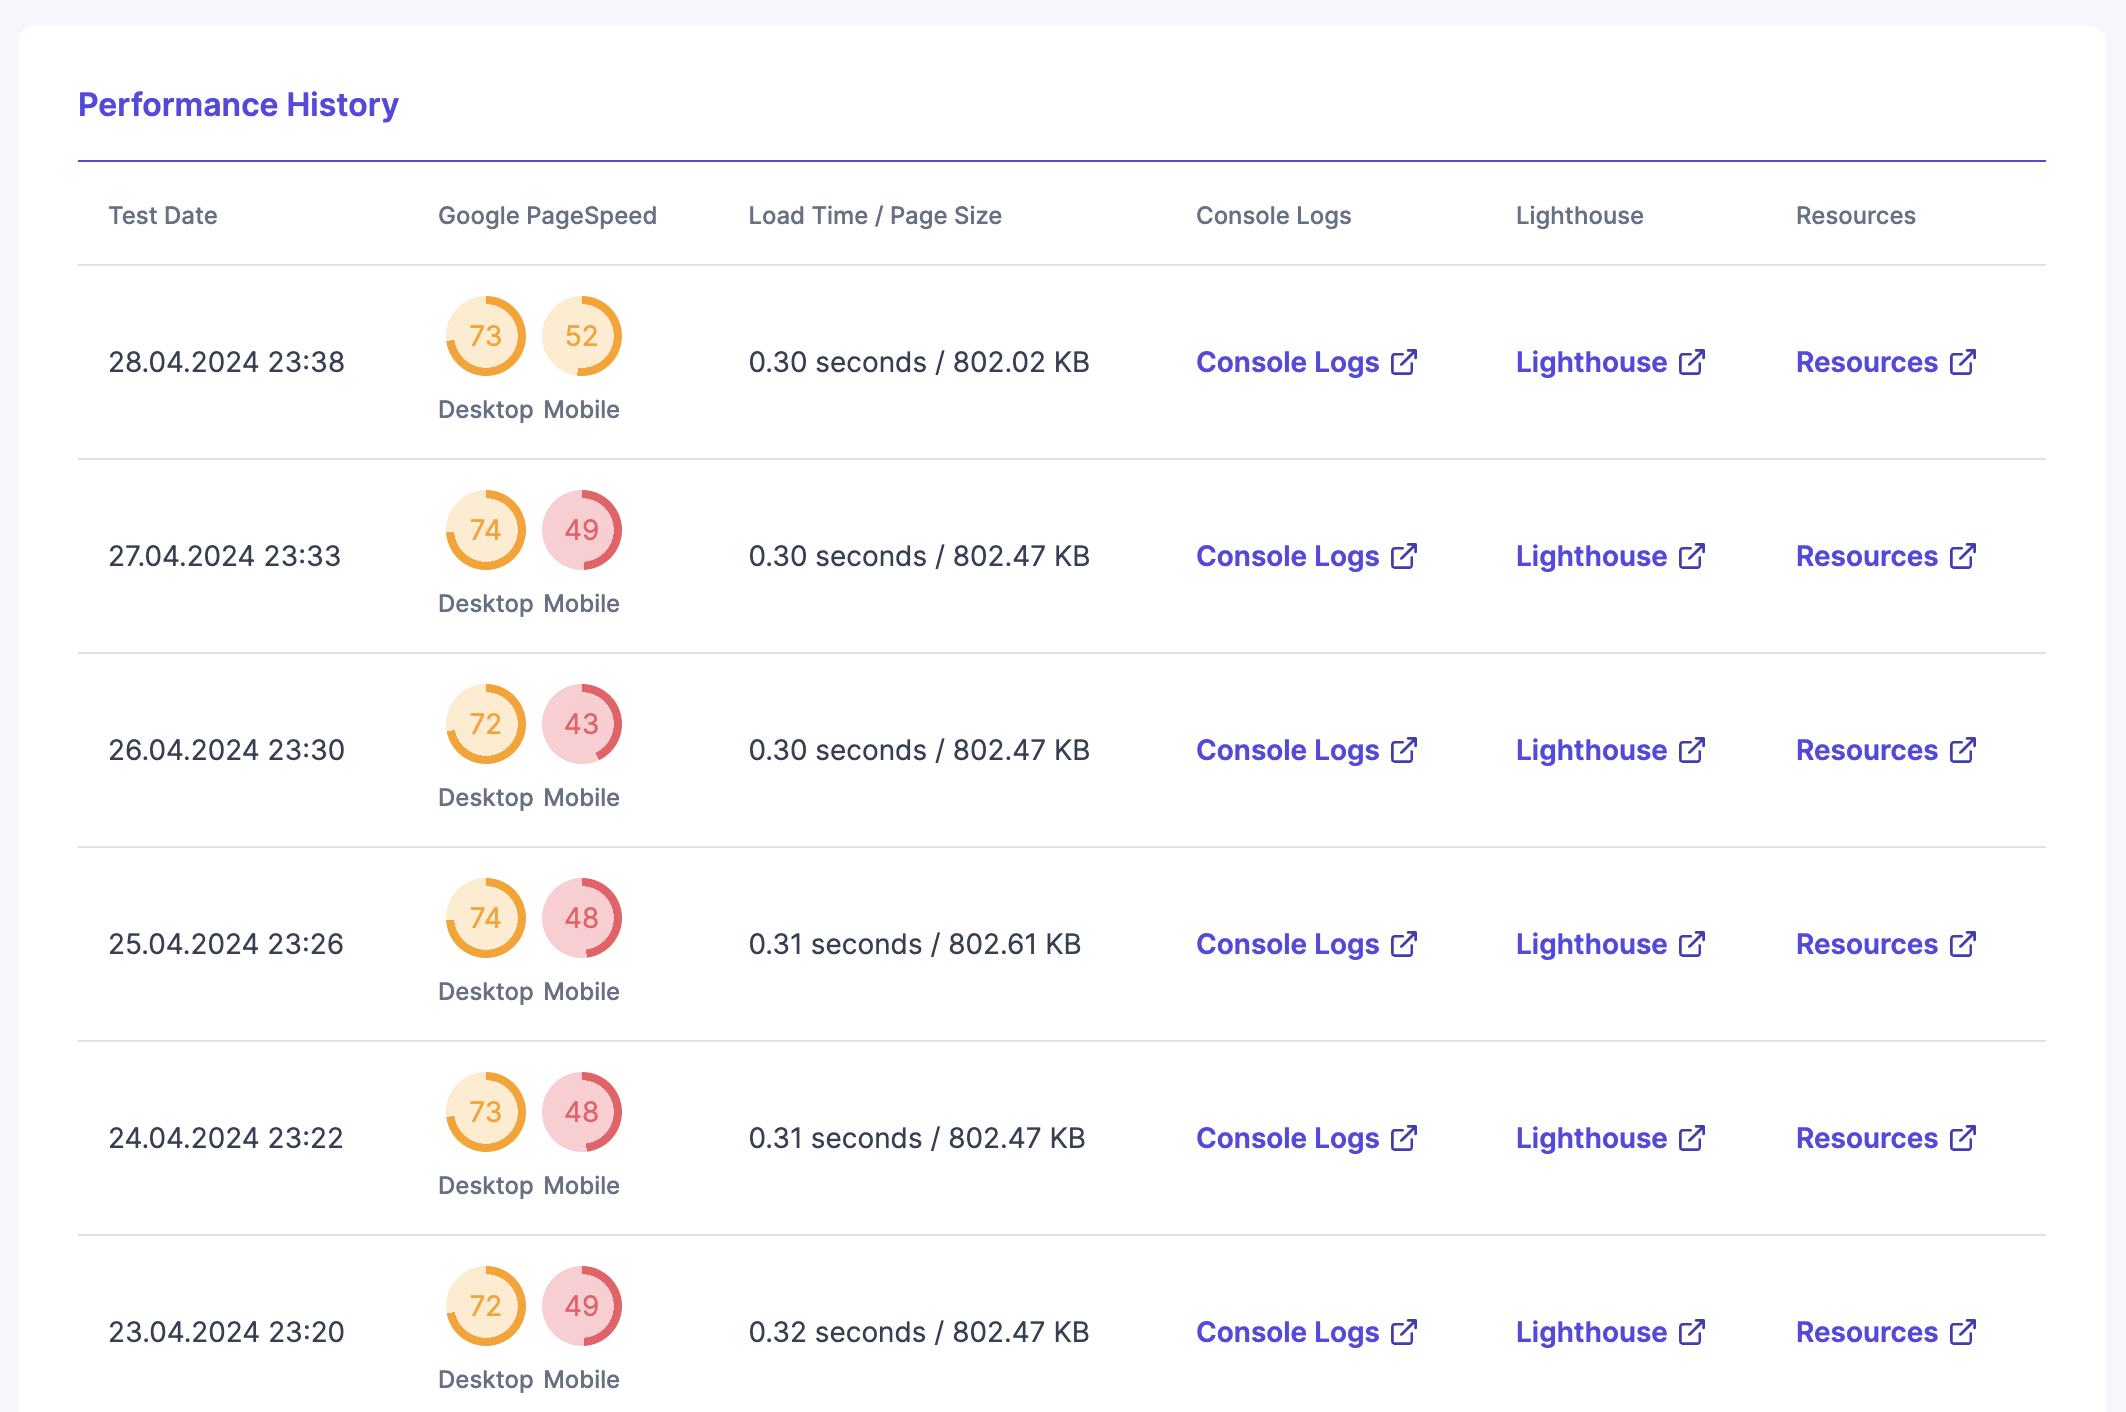
By having access to day-by-day performance snapshots, you can analyze trends, pinpoint the onset of issues, and assess the impact of changes you’ve implemented. This detailed historical perspective is essential for strategic decision-making and ongoing optimization efforts, ensuring that you maintain and enhance your site’s performance over time.
Sub Pages
The Sub Pages section of the Observer Dashboard extends monitoring beyond your homepage to include critical sub-pages of your website. Upon adding your site to Observer, it automatically detects these important pages, though you have the flexibility to edit and customize which pages are monitored within this section. This feature is particularly valuable as it allows for a more comprehensive understanding of your site’s overall performance.
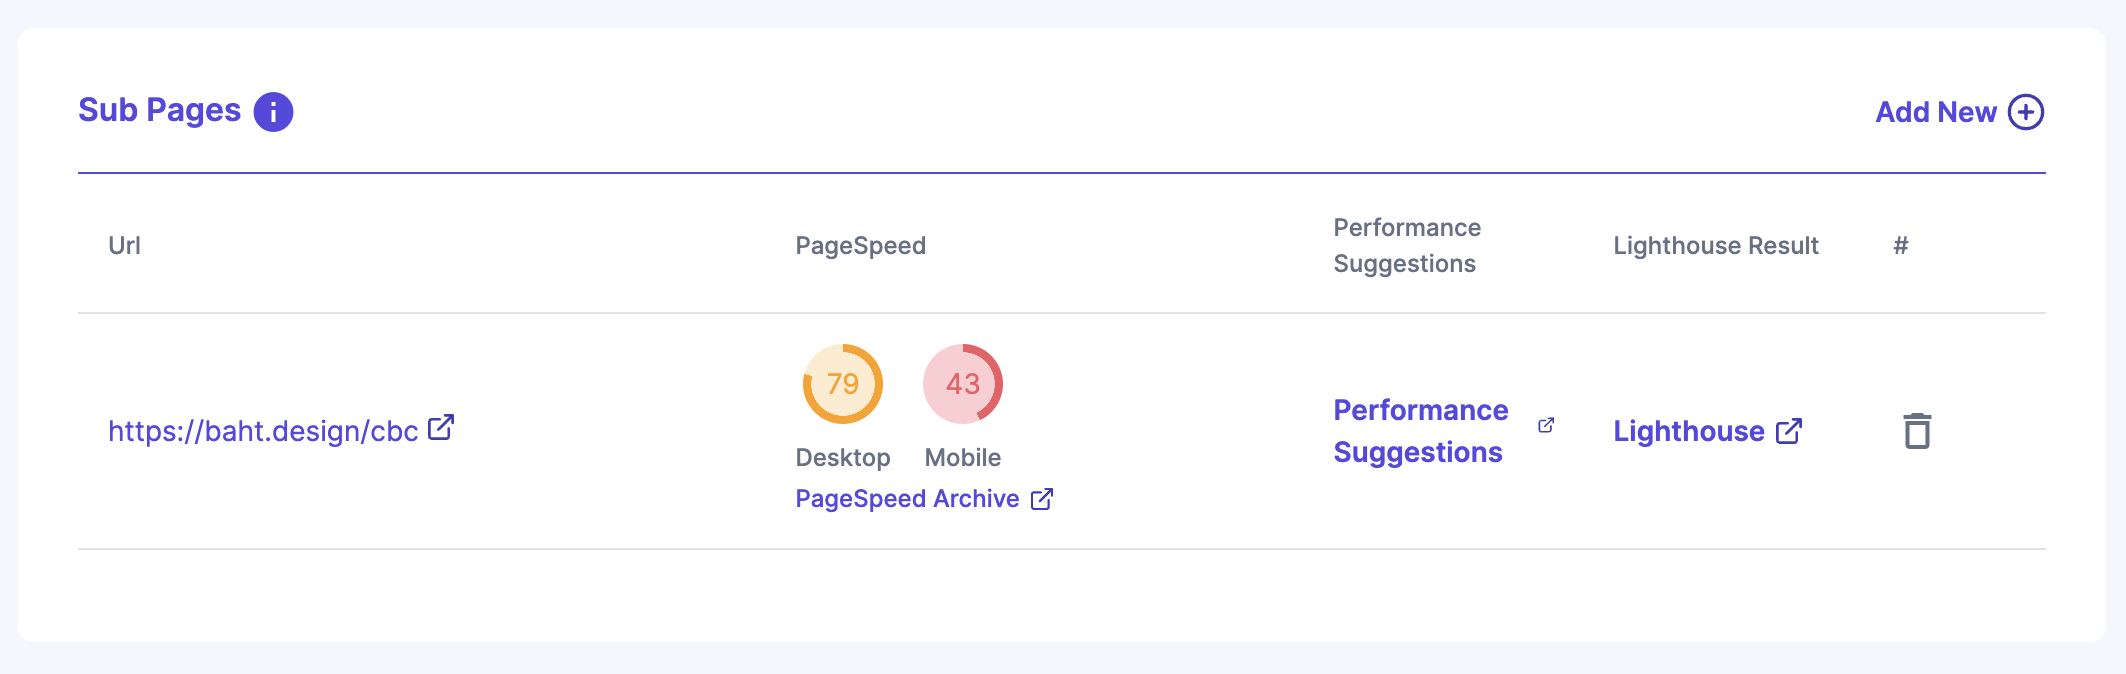
Observer takes these sub-pages into account when generating performance suggestions, ensuring that the insights you receive are holistic and encompassing. Additionally, you can track and compare the performance scores of these individual pages directly from this section, helping you to identify specific areas for improvement across your entire site.
This overview of the Observer Dashboard underscores its critical role in maintaining and enhancing your website’s performance. By regularly checking the comprehensive insights and metrics provided across various sections, you can proactively manage your site’s health and efficiency. Keeping a close eye on the dashboard ensures that you are always informed about your website’s status and can quickly respond to any issues, ultimately ensuring that your site continues to perform optimally and deliver a superior user experience. Sign up for Observer today and take control of your website’s performance with real-time monitoring and actionable insights.

Managing multiple websites can be a daunting task, especially when it comes to ensuring their health and performance. In this blog post, we’ll explore the common problems faced in website management and how Observer can help you solve them.

Discover the hidden truths behind SEO that can transform your website’s performance.
In this blog post, we’ll dive into the world of web hosting. Understanding your options and knowing how to choose the right type of hosting for your website are crucial steps in managing a successful online presence.
Select free plan to meet or have a powerful assistant that includes all our features.