Mastering the Browser Console: Essential Tips for Monitoring Website Health and Performance
Unlock the full potential of your web browser’s console with our in-depth guide. Learn how to access, interpret, and utilize this powerful tool to enhance your website’s health and performance.
Browser console a powerful tool tucked away within your web browser that offers a lot of information on website health and performance. Whether you’re a developer, a website owner, or simply someone interested in understanding the inner workings of web technologies, mastering the browser console can significantly enhance your ability to diagnose and resolve issues.
In this blog post, we’ll guide you through accessing the console, interpreting its data, and utilizing its features to keep your site running smoothly and efficiently. Get ready to unlock a deeper insight into your website’s functionality and learn how to tackle common challenges directly from your browser.
What the browser console is?
The browser console is a built-in developer tool available in all modern web browsers. It serves as a testing and debugging interface, providing real-time insights into the operational aspects of a website, including JavaScript execution, CSS rendering, and HTTP requests.
Beyond simply outputting information, the console also offers a command line interface where developers can execute JavaScript code, interact with the Document Object Model (DOM), and access a variety of debugging tools. This powerful feature is essential for anyone looking to optimize performance, debug issues, or simply understand how web applications operate under the hood. Whether you’re testing new code or analyzing performance bottlenecks, the browser console is an invaluable resource for deep diving into your site’s detailed processes.
What can browser console be used for?
The browser console is an invaluable tool for website diagnostics due to its direct access to a website’s inner workings. Here’s why using the browser console is crucial for anyone involved in web development or maintenance:
Immediate Error Detection
The console displays JavaScript errors in real time as they occur. This instant feedback is crucial for developers to quickly identify and correct issues that could affect user experience or functionality.
Performance Monitoring
Developers can use the console to measure how long specific operations take to execute, helping to pinpoint performance issues such as slow script execution or resource loading delays. This makes it easier to optimize website speed and responsiveness.
Network Activity Insights
The console provides detailed information about network requests, including failed HTTP requests, which can be vital for debugging issues related to content loading or API interactions.
Security Audits
Regularly reviewing console messages can help detect security warnings and potential vulnerabilities, such as cross-site scripting (XSS) attacks or content security policy (CSP) violations, allowing for timely interventions.
Live DOM Interaction and Manipulation
The console allows developers to interact with the DOM in real-time. This capability is particularly useful for experimenting with changes to the HTML and CSS of a page without making permanent adjustments, providing a sandbox for optimization and testing.
Access to Web Storage
Using the console, developers can inspect and manage the data stored in local and session storage, which is essential for troubleshooting and managing stateful web applications.
Learning and Experimentation
For those learning web development, the console offers a hands-on way to understand how browser-based code executes and affects a web page. It’s a practical tool for teaching, learning, and experimenting with code.
How to Access the Browser Console
Accessing the browser console is a straightforward process that varies slightly depending on the web browser you are using. Here’s how you can open the browser console in some of the most popular web browsers
| Browser | Shortcut (Windows/Linux) | Shortcut (macOS) | Menu |
|---|---|---|---|
| Google Chrome | Ctrl + Shift + J | Cmd + Option + J | Click on the three dots at the top-right corner to open the menu, go to “More tools,” and then select “Developer tools.” From there, click on the “Console” tab. |
| Mozilla Firefox | Ctrl + Shift + K | Cmd + Option + K | Click on the three horizontal lines in the top-right corner, select “Web Developer,” and then “Web Console.” |
| Safari | N/A | N/A | Go to Safari’s Preferences by clicking Safari > Preferences in the menu bar, then go to the “Advanced” tab and check the box at the bottom that says “Show Develop menu in menu bar.” With the Develop menu enabled, click Develop in the menu bar and select “Show JavaScript Console.” |
| Microsoft Edge | Ctrl + Shift + J | Cmd + Option + J | Click on the three dots at the top-right corner to open the menu, go to “More tools,” and then select “Developer tools.” Then, select the “Console” tab. |
| Opera | Ctrl + Shift + I | Cmd + Option + I | Click on the Opera logo in the top-left corner, select “Developer,” and then “Developer tools.” Navigate to the “Console” tab. |
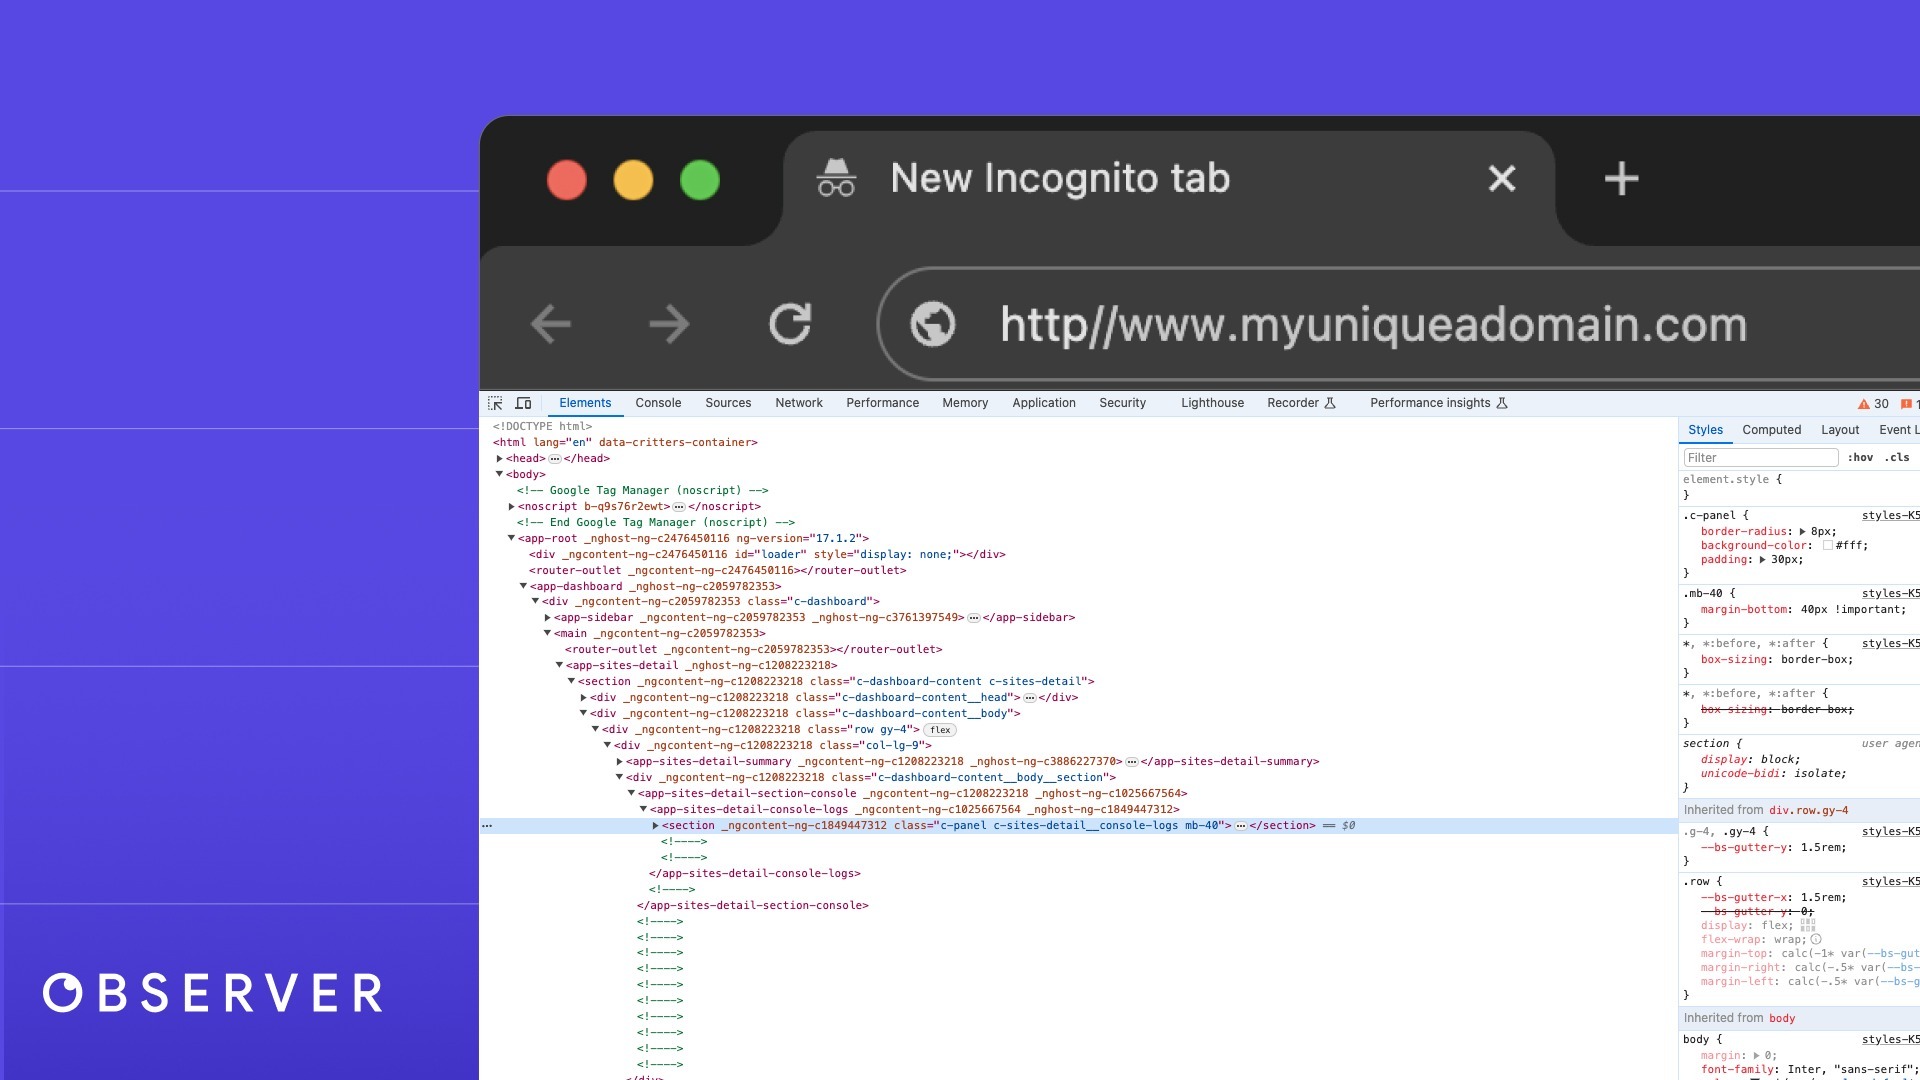
Once you have the console open, you will see a command line where you can type JavaScript commands and a window that displays logs, errors, warnings, and other messages. Familiarizing yourself with these controls and the types of information the console provides is crucial for effectively using it to diagnose and resolve issues on your website.
Identifying and Troubleshooting Common Issues in Browser Console
The browser console is a broad subject with a range of functionalities that cater to various aspects of web development and maintenance. In this post, we’ll focus specifically on how the console can be incredibly useful for identifying and troubleshooting common issues that may affect website performance and user experience.
JavaScript Errors
JavaScript errors can cause parts of your website to malfunction or not run at all. The console will display JavaScript errors with a red icon and provide an error message along with a line number and file reference. You can click on the error to jump directly to the offending line of code in the source file. Analyzing the error message and the associated code can help determine why the error is occurring and guide you on how to fix it.
Network Problems
Failed network requests can prevent your website from loading resources such as scripts, stylesheets, and images, which can lead to broken functionality or layout issues.
The Network tab in the browser console shows all network requests made by your page along with their status. Requests that fail will typically show a status code such as 404 (Not Found) or 500 (Server Error). By examining these failed requests, you can identify missing files or server-side problems that need addressing.
Performance Bottlenecks
Slow page load times and sluggish response times can frustrate users and lead to poor site performance.
The Performance tab in the console allows you to record your site’s activity over a period and then analyze the events that take place when a page is loaded. This can reveal issues such as lengthy JavaScript execution or excessive re-rendering. The Waterfall view and flame charts can help pinpoint exactly where delays are occurring.
CSS and Styling Issues
CSS problems can cause visual issues on your site, which can lead to a poor user experience. The console will often display warnings if there are issues with your CSS, such as properties that have no effect or syntax errors in your stylesheets. Using the console’s Elements tab, you can inspect elements and see which styles are being applied and how they are computed, helping you understand and fix the styling issues.
Security Warnings
Security issues, if unnoticed, can lead to vulnerabilities in your website. The console will log security warnings when there are issues like mixed content (where secure and non-secure contents are mixed), use of deprecated APIs, or other security concerns. These warnings include detailed messages and suggestions for resolving the issues.
How Observer Enhances Browser Console Monitoring
While the browser console is a powerful tool for developers to manually diagnose and fix issues in real-time, Observer takes this a step further by automating the monitoring and alerting processes.
Observer continuously monitors your website’s browser console for any new errors or JavaScript issues that arise. This includes runtime errors, syntax errors, and other exceptions that could disrupt the user experience.
Along with errors, Observer also tracks warnings and other important notifications from the browser console. This includes deprecated API usage, security warnings like mixed content issues, and other critical insights that could potentially affect your site’s performance and user safety. Whenever Observer detects issues, it sends immediate alerts to you or your development team.
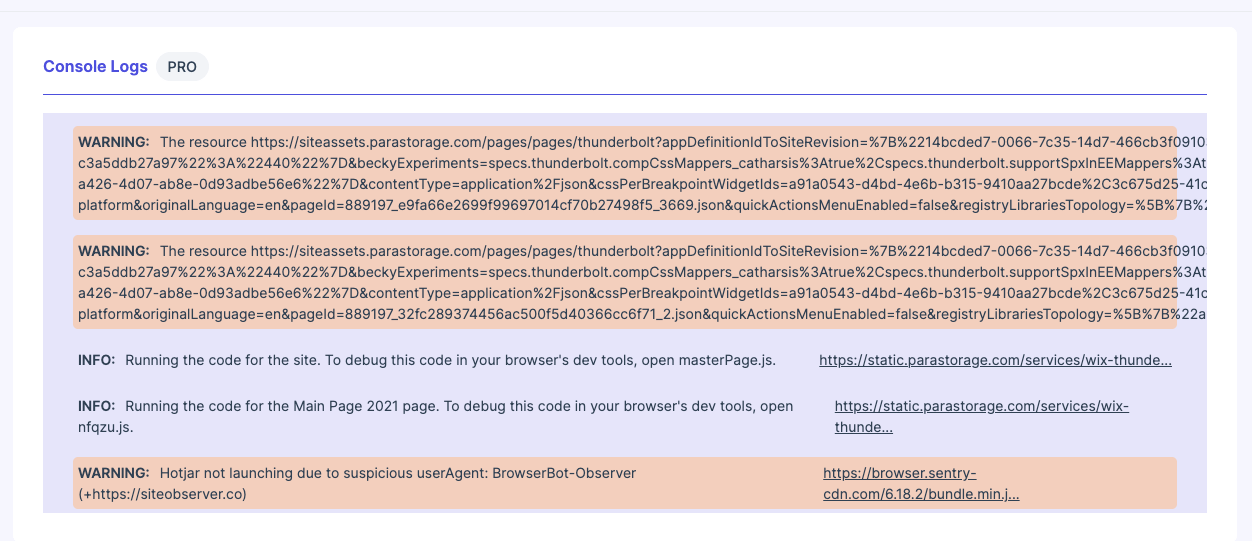
Observer not only alerts you to immediate issues but also compiles these into comprehensive reports. These reports provide an overview of all console logs, errors, and warnings over a selected period, giving you deeper insight into recurring issues or patterns that may require systematic changes.
Embrace the power of automation and enhance your website’s reliability with Observer. Register for Observer today and start benefiting from real-time alerts and in-depth insights that will help you maintain and optimize your website more efficiently.

Managing multiple websites can be a daunting task, especially when it comes to ensuring their health and performance. In this blog post, we’ll explore the common problems faced in website management and how Observer can help you solve them.

Discover the hidden truths behind SEO that can transform your website’s performance.
In this blog post, we’ll dive into the world of web hosting. Understanding your options and knowing how to choose the right type of hosting for your website are crucial steps in managing a successful online presence.
Select free plan to meet or have a powerful assistant that includes all our features.