Total
11.65 MB
105 requests
100% of total size
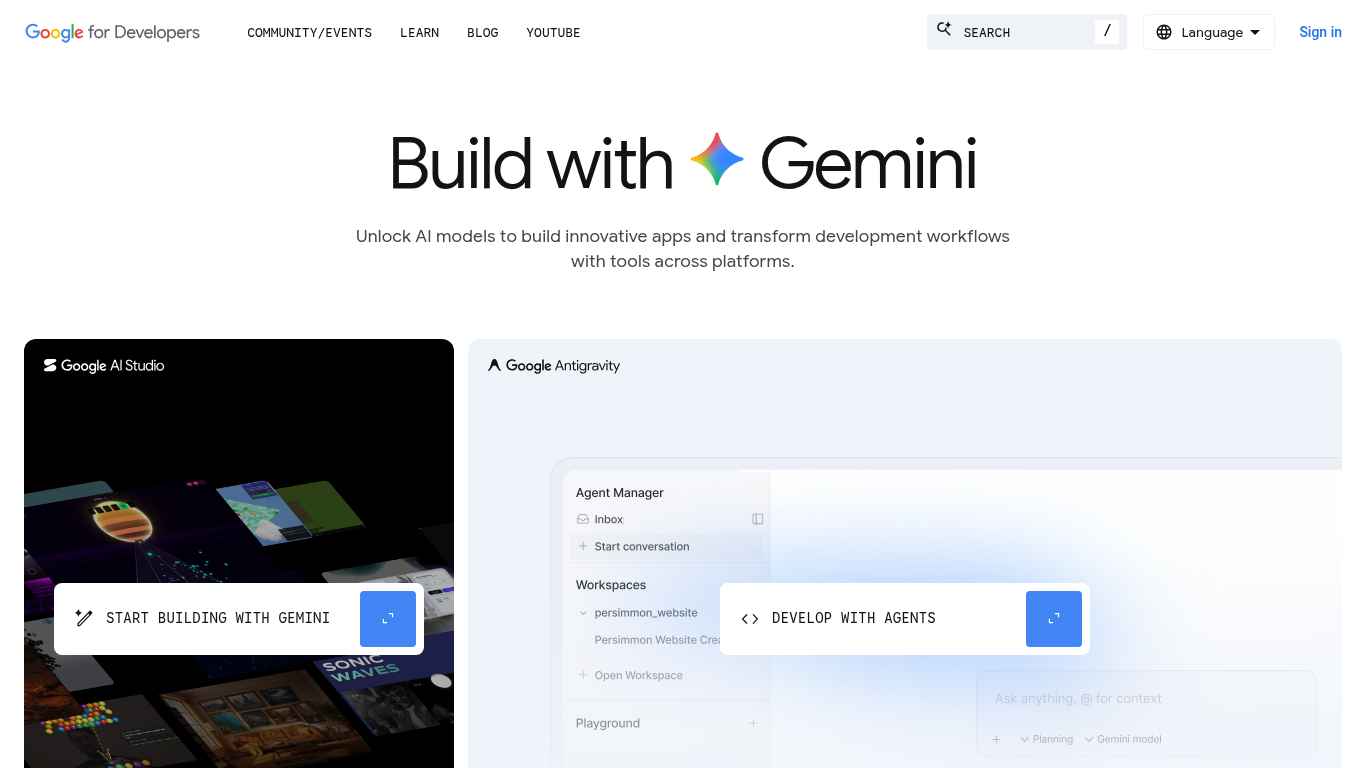
Screenshot captured after 9.24 s.
Google for Developers | Build with Gemini
See the website health and performance test results for https://developers.google.com/, including status code, load speed, SSL, WHOIS, DNS, console logs, Chrome UX Report, resource sizes, and Pagespeed findings.
Tested on 18 Jun 2026 20:45:56.
Up
- HTTP status 200
- Response time 929 ms
- Document load time 2.3 s
- Full page load time 9.24 s
- Document size 30.31 KB
- Full page size 4.79 MB
52/100
- Mobile score 52
- Desktop score 57
Observer's Performance Suggestions
Priority actions Observer identified from this test to improve speed, reliability, and user experience.
|
13 images served larger than displayed
Error
Medium
13 images are served at intrinsic dimensions more than 120% of their display size. Worst offender is 447% of display size. Resize images to match their rendered dimensions to save bandwidth. Read more |
|
Slow Speed Index (19.4 s)
Warning
High
The page takes too long to visually complete. Optimize critical rendering path, reduce render-blocking resources, and serve visible content first. Read more |
|
LCP image TTFB is slow
Warning
High
The p75 LCP image time-to-first-byte is 1431 ms. Use a faster origin server, CDN, or preconnect hints to reduce initial response time. Read more |
|
Desktop performance needs improvement (57/100)
Warning
Medium
Score is below 90. Tackle the highest-impact audits to push into the green. Read more |
|
Slow Speed Index (3.8 s)
Warning
Medium
The page takes too long to visually complete. Optimize critical rendering path, reduce render-blocking resources, and serve visible content first. Read more |
|
Mobile performance needs improvement (52/100)
Warning
Medium
Score is below 90. Tackle the highest-impact audits to push into the green. Read more |
|
High Total Blocking Time (210 ms)
Warning
Medium
Long JavaScript tasks block the main thread, making the page feel unresponsive. Split long tasks, defer non-critical scripts, and reduce third-party JavaScript. Read more |
|
Fewer than 75% of users have a good Largest Contentful Paint
Warning
Medium
Only 75% of real-user samples fall in the "good" bucket for Largest Contentful Paint. Read more |
|
Fewer than 75% of users have a good Cumulative Layout Shift
Warning
Medium
Only 61% of real-user samples fall in the "good" bucket for Cumulative Layout Shift. Read more |
|
Fewer than 75% of users have a good First Contentful Paint
Warning
Medium
Only 65% of real-user samples fall in the "good" bucket for First Contentful Paint. Read more |
Only the top 10 of 25 suggestions are shown in the public test. To see all recommendations and track every change on your website, register now.
Did you know?
Observer tracks these signals every day and alerts you the moment something important changes. Register now.
13 Sep 2028
812 days left
17 Aug 2026
54 days left
Whois
- Registrar
- MarkMonitor, Inc.
- Created
- 15 Sep 1997
- Updated
- 2 Aug 2024
- Expires
- 13 Sep 2028
- Country
- US
- DNSSEC
- unsigned
SSL
- SSL available
- Yes
- SSL status
- valid
- Issuer
- C=US,O=Google Trust Services,CN=WE2
- Subject
- CN=*.google.com
- TLS version
- TLSv1.3
- Self-signed
- No
- Valid until
- 17 Aug 2026
DNS Records
Current DNS records returned for this domain at the time of the test.
- DNS status
- resolved
- 172.217.23.142
- 2a00:1450:4017:81c::200e
No records returned.
- smtp.google.com
- ns1.google.com
- ns2.google.com
- ns3.google.com
- ns4.google.com
- MS=E4A68B9AB2BB9670BCE15412F62916164C0B20BB
- apple-domain-verification=30afIBcvSuDV2PLX
- cisco-ci-domain-verification=47c38bc8c4b74b7233e9053220c1bbe76bcc1cd33c7acf7acd36cd6a5332004b
- docusign=05958488-4752-4ef2-95eb-aa7ba8a3bd0e
- docusign=1b0a6754-49b1-4db5-8540-d2c12664b289
- facebook-domain-verification=22rm551cu4k0ab0bxsw536tlds4h95
- globalsign-smime-dv=CDYX+XFHUw2wml6/Gb8+59BsH31KzUr6c1l2BPvqKX8=
- google-site-verification=4ibFUgB-wXLQ_S7vsXVomSTVamuOXBiVAzpR5IZ87D0
- google-site-verification=TV9-DBe4R80X4v0M4U_bd_J9cpOJM0nikft0jAgjmsQ
- google-site-verification=wD8N7i1JTNTkezJ49swvWW48f8_9xveREV4oB-0Hf5o
- onetrust-domain-verification=0d477fe608074e6f9c12bca7826035cc
- onetrust-domain-verification=6d685f1d41a94696ad7ef771f68993e0
- v=spf1 include:_spf.google.com ~all
Resource Summary
Transfer size share of the tested page split by resource type.
Image
6.47 MB
29 requests
56% of total size
Font
2.76 MB
6 requests
24% of total size
Script
1.67 MB
52 requests
14% of total size
Media
542.56 KB
1 requests
4.5% of total size
Stylesheet
195.79 KB
6 requests
1.6% of total size
Document
32.09 KB
2 requests
0.3% of total size
Other
7.26 KB
9 requests
0.1% of total size
Third-party
6.67 MB
67 requests
57% of total size
Total
11.67 MB
114 requests
100% of total size
Image
6.47 MB
29 requests
55% of total size
Font
2.76 MB
6 requests
24% of total size
Script
1.68 MB
61 requests
14% of total size
Media
542.56 KB
1 requests
4.5% of total size
Stylesheet
195.66 KB
6 requests
1.6% of total size
Document
32.24 KB
2 requests
0.3% of total size
Other
7.26 KB
9 requests
0.1% of total size
Third-party
6.69 MB
76 requests
57% of total size
Core Web Vitals
Key performance signals from Lighthouse, with color-coded status for what is healthy and what still needs work.
The server starts responding quickly.
Users wait too long before any content appears.
Main visible content takes too long to appear.
The layout stays visually stable while loading.
Visual loading is significantly delayed.
Script execution still delays interactivity.
Potential input delay may still feel sluggish.
Users wait too long before the page responds.
TTFB
637 ms
FCP
18.64 s
LCP
47.22 s
TTI
50.23 s
The server starts responding quickly.
First visible content is slower than recommended.
Main visible content takes too long to appear.
The layout stays visually stable while loading.
Visual progress is slower than recommended.
Main thread blocking stays in a healthy range.
Potential input delay stays low.
Users wait too long before the page responds.
TTFB
188 ms
FCP
2.99 s
LCP
7.43 s
TTI
8.8 s
Loading Filmstrip
Visual loading progress from the Lighthouse run, shown in time order.


Google Pagespeed Insights
Switch between desktop and mobile Lighthouse results to review the latest performance findings for this page.
Mobile
52
Desktop
57
Audit Details
| Audit | Insight | Impact |
|---|---|---|
| Render-blocking requests |
Requests are blocking the page's initial render, which may delay LCP. Deferring or inlining can move these network requests out of the critical path.
|
Est savings of 16,340 ms |
| Reduce unused JavaScript |
Reduce unused JavaScript and defer loading scripts until they are required to decrease bytes consumed by network activity. Learn how to reduce unused JavaScript.
|
Est savings of 515 KiB |
| Forced reflow |
A forced reflow occurs when JavaScript queries geometric properties (such as offsetWidth) after styles have been invalidated by a change to the DOM state. This can result in poor performance. Learn more about forced reflows and possible mitigations.
|
Open |
| Largest Contentful Paint |
Largest Contentful Paint marks the time at which the largest text or image is painted. Learn more about the Largest Contentful Paint metric |
47.2 s |
| Improve image delivery |
Reducing the download time of images can improve the perceived load time of the page and LCP. Learn more about optimizing image size
|
Est savings of 1,405 KiB |
| LCP request discovery |
Optimize LCP by making the LCP image discoverable from the HTML immediately, and avoiding lazy-loading |
Open |
| Time to Interactive |
Time to Interactive is the amount of time it takes for the page to become fully interactive. Learn more about the Time to Interactive metric. |
50.2 s |
| Reduce unused CSS |
Reduce unused rules from stylesheets and defer CSS not used for above-the-fold content to decrease bytes consumed by network activity. Learn how to reduce unused CSS.
|
Est savings of 164 KiB |
| Network dependency tree |
Avoid chaining critical requests by reducing the length of chains, reducing the download size of resources, or deferring the download of unnecessary resources to improve page load. |
Open |
| First Contentful Paint |
First Contentful Paint marks the time at which the first text or image is painted. Learn more about the First Contentful Paint metric. |
18.6 s |
| Speed Index |
Speed Index shows how quickly the contents of a page are visibly populated. Learn more about the Speed Index metric. |
19.4 s |
| Use efficient cache lifetimes |
A long cache lifetime can speed up repeat visits to your page. Learn more about caching.
|
Est savings of 33 KiB |
| Font display |
Consider setting font-display to swap or optional to ensure text is consistently visible. swap can be further optimized to mitigate layout shifts with font metric overrides.
|
Est savings of 10 ms |
| Image elements do not have explicit `width` and `height` |
Set an explicit width and height on image elements to reduce layout shifts and improve CLS. Learn how to set image dimensions
|
Open |
| Avoid enormous network payloads |
Large network payloads cost users real money and are highly correlated with long load times. Learn how to reduce payload sizes.
|
Total size was 11,929 KiB |
| Max Potential First Input Delay |
The maximum potential First Input Delay that your users could experience is the duration of the longest task. Learn more about the Maximum Potential First Input Delay metric. |
230 ms |
| Total Blocking Time |
Sum of all time periods between FCP and Time to Interactive, when task length exceeded 50ms, expressed in milliseconds. Learn more about the Total Blocking Time metric. |
210 ms |
Audit Details
| Audit | Insight | Impact |
|---|---|---|
| Network dependency tree |
Avoid chaining critical requests by reducing the length of chains, reducing the download size of resources, or deferring the download of unnecessary resources to improve page load. |
Open |
| Reduce unused CSS |
Reduce unused rules from stylesheets and defer CSS not used for above-the-fold content to decrease bytes consumed by network activity. Learn how to reduce unused CSS.
|
Est savings of 166 KiB |
| Render-blocking requests |
Requests are blocking the page's initial render, which may delay LCP. Deferring or inlining can move these network requests out of the critical path.
|
Est savings of 2,850 ms |
| Improve image delivery |
Reducing the download time of images can improve the perceived load time of the page and LCP. Learn more about optimizing image size
|
Est savings of 2,262 KiB |
| Reduce unused JavaScript |
Reduce unused JavaScript and defer loading scripts until they are required to decrease bytes consumed by network activity. Learn how to reduce unused JavaScript.
|
Est savings of 702 KiB |
| Forced reflow |
A forced reflow occurs when JavaScript queries geometric properties (such as offsetWidth) after styles have been invalidated by a change to the DOM state. This can result in poor performance. Learn more about forced reflows and possible mitigations.
|
Open |
| LCP request discovery |
Optimize LCP by making the LCP image discoverable from the HTML immediately, and avoiding lazy-loading |
Open |
| Largest Contentful Paint |
Largest Contentful Paint marks the time at which the largest text or image is painted. Learn more about the Largest Contentful Paint metric |
7.4 s |
| First Contentful Paint |
First Contentful Paint marks the time at which the first text or image is painted. Learn more about the First Contentful Paint metric. |
3.0 s |
| Time to Interactive |
Time to Interactive is the amount of time it takes for the page to become fully interactive. Learn more about the Time to Interactive metric. |
8.8 s |
| Speed Index |
Speed Index shows how quickly the contents of a page are visibly populated. Learn more about the Speed Index metric. |
3.8 s |
| Image elements do not have explicit `width` and `height` |
Set an explicit width and height on image elements to reduce layout shifts and improve CLS. Learn how to set image dimensions
|
Open |
| Avoid enormous network payloads |
Large network payloads cost users real money and are highly correlated with long load times. Learn how to reduce payload sizes.
|
Total size was 11,947 KiB |
| Font display |
Consider setting font-display to swap or optional to ensure text is consistently visible. swap can be further optimized to mitigate layout shifts with font metric overrides.
|
Est savings of 20 ms |
| Use efficient cache lifetimes |
A long cache lifetime can speed up repeat visits to your page. Learn more about caching.
|
Est savings of 33 KiB |
Browser Console Logs
Messages captured from the browser console during the real page test.
warn
Unrecognized DevSite custom element - DevsiteCaptcha NotSupportedError: Failed to execute 'define' on 'CustomElementRegistry': the name "devsite-captcha" has already been used with this registry
Chrome UX Report
Real-user experience shares from recent Chrome visits to this website.
Origin: https://developers.google.com
Mobile 43.2%
Desktop 55.3%
Tablet 1.5%
| Metric | User experience share | 75th percentile |
|---|---|---|
| LCP |
Good 74.6%
Needs improvement 15.6%
Poor 9.8%
|
2.52 s |
| INP |
Good 88.3%
Needs improvement 8.4%
Poor 3.2%
|
111 ms |
| CLS |
Good 60.9%
Needs improvement 24.1%
Poor 15.0%
|
0.17 |
| FCP |
Good 65.2%
Needs improvement 22.6%
Poor 12.2%
|
2.15 s |
| TTFB |
Good 23.6%
Needs improvement 57.7%
Poor 18.7%
|
1.6 s |
Resources by Transfer Size
Largest transferred resources captured during the browser test, sorted from heaviest to lightest.
| Resource | Type | Status | Duration | Transfer size | Decoded size | Blocking |
|---|---|---|---|---|---|---|
|
developers.google.com
|
css | 200 | 1.3 s | 716.62 KB | 716.33 KB | non-blocking |
|
developers.google.com
|
css | 200 | 1.3 s | 713.2 KB | 712.91 KB | non-blocking |
|
developers.google.com
|
video | 200 | 1.39 s | 542.05 KB | 541.76 KB | non-blocking |
|
developers.google.com
|
img | 200 | 1.38 s | 460.62 KB | 460.32 KB | non-blocking |
|
developers.google.com
|
css | 200 | 1.19 s | 374.94 KB | 374.65 KB | non-blocking |
|
developers.google.com
|
img | 200 | 1.19 s | 309.95 KB | 309.66 KB | non-blocking |
|
developers.google.com
|
img | 200 | 1.08 s | 259.76 KB | 259.47 KB | non-blocking |
|
developers.google.com
|
img | 200 | 1.29 s | 239.94 KB | 239.65 KB | non-blocking |
|
developers.google.com
|
css | 200 | 982 ms | 223.63 KB | 223.33 KB | non-blocking |
|
developers.google.com
|
css | 200 | 903 ms | 195.8 KB | 195.51 KB | non-blocking |
|
developers.google.com
|
img | 200 | 689 ms | 193 KB | 192.71 KB | non-blocking |
|
developers.google.com
|
img | 200 | 677 ms | 106.65 KB | 106.35 KB | non-blocking |
|
developers.google.com
|
img | 200 | 584 ms | 98.65 KB | 98.35 KB | non-blocking |
|
developers.google.com
|
img | 200 | 581 ms | 77.86 KB | 77.56 KB | non-blocking |
|
developers.google.com
|
img | 200 | 581 ms | 74.77 KB | 74.48 KB | non-blocking |
|
developers.google.com
|
img | 200 | 388 ms | 55.26 KB | 54.96 KB | non-blocking |
|
developers.google.com
|
img | 200 | 510 ms | 49.63 KB | 49.34 KB | non-blocking |
|
developers.google.com
|
css | 200 | 593 ms | 39.51 KB | 39.21 KB | non-blocking |
|
developers.google.com
|
img | 200 | 507 ms | 33.78 KB | 33.49 KB | non-blocking |
|
developers.google.com
|
css | 200 | 498 ms | 33.31 KB | 33.01 KB | non-blocking |
|
developers.google.com
|
img | 200 | 386 ms | 17.34 KB | 17.05 KB | non-blocking |
|
developers.google.com
|
img | 200 | 488 ms | 13.95 KB | 13.66 KB | non-blocking |
|
developers.google.com
|
img | 200 | 378 ms | 13.9 KB | 13.6 KB | non-blocking |
|
developers.google.com
|
img | 200 | 379 ms | 13.15 KB | 12.85 KB | non-blocking |
|
developers.google.com
|
img | 200 | 384 ms | 10.63 KB | 10.34 KB | non-blocking |
|
developers.google.com
|
img | 200 | 371 ms | 10.5 KB | 10.2 KB | non-blocking |
|
developers.google.com
|
img | 200 | 383 ms | 9.56 KB | 9.27 KB | non-blocking |
|
developers.google.com
|
img | 200 | 376 ms | 8.49 KB | 8.2 KB | non-blocking |
| link | 0 | 277 ms | 3.39 KB | 60.31 KB | blocking | |
| link | 0 | 283 ms | 2.52 KB | 20.08 KB | blocking | |
|
fonts.googleapis.com
|
link | 0 | 274 ms | 2.02 KB | 6.93 KB | blocking |
|
fonts.googleapis.com
|
link | 0 | 273 ms | 800 B | 1.28 KB | blocking |
| link | 0 | 276 ms | 732 B | 712 B | blocking | |
|
developers.google.com
|
fetch | 200 | 419 ms | 523 B | 355 B | non-blocking |
|
developers.google.com
|
fetch | 200 | 392 ms | 322 B | 2 B | non-blocking |
| link | 0 | 197 ms | 0 B | 0 B | blocking | |
| img | 0 | 192 ms | 0 B | 0 B | non-blocking | |
| script | 0 | 8 ms | 0 B | 0 B | non-blocking | |
|
www.gstatic.com
|
css | 0 | 811 ms | 0 B | 0 B | non-blocking |
| script | 0 | 103 ms | 0 B | 0 B | non-blocking | |
| script | 0 | 166 ms | 0 B | 0 B | non-blocking | |
| script | 0 | 59 ms | 0 B | 0 B | non-blocking | |
| script | 0 | 278 ms | 0 B | 0 B | non-blocking | |
| script | 0 | 382 ms | 0 B | 0 B | non-blocking | |
| script | 0 | 382 ms | 0 B | 0 B | non-blocking | |
| script | 0 | 372 ms | 0 B | 0 B | non-blocking | |
| script | 0 | 387 ms | 0 B | 0 B | non-blocking | |
| script | 0 | 384 ms | 0 B | 0 B | non-blocking | |
| script | 0 | 382 ms | 0 B | 0 B | non-blocking | |
| script | 0 | 383 ms | 0 B | 0 B | non-blocking |
Get daily monitoring and instant alerts with Observer.
Register Observer to keep testing your website automatically and react faster when something breaks.
Try Observer Discover