Total
3.54 MB
84 requests
100% of total size
Domain registration expires soon
The domain registration is due to expire on 3 Sep 2026.

Screenshot captured after 2.12 s.
Prosim Dış Ticaret Kimya San. A.Ş.
See the website health and performance test results for https://prosim.com.tr/, including status code, load speed, SSL, WHOIS, DNS, console logs, Chrome UX Report, resource sizes, and Pagespeed findings.
Tested on 22 May 2026 13:56:13.
Up
- HTTP status 200
- Response time 126 ms
- Document load time 1.51 s
- Full page load time 2.12 s
- Document size 27.71 KB
- Full page size 2.69 MB
60/100
- Mobile score 60
- Desktop score 68
Observer's Performance Suggestions
Priority actions Observer identified from this test to improve speed, reliability, and user experience.
|
2 images served larger than displayed
Error
Medium
2 images are served at intrinsic dimensions more than 120% of their display size. Worst offender is 2024% of display size. Resize images to match their rendered dimensions to save bandwidth. Read more |
|
No H1 element found
Error
Low
The page is missing an <h1> tag. An H1 heading helps search engines and screen readers understand the primary topic of the page. Read more |
|
Slow Speed Index (6.4 s)
Warning
High
The page takes too long to visually complete. Optimize critical rendering path, reduce render-blocking resources, and serve visible content first. Read more |
|
Missing canonical tag
Warning
High
No <link rel="canonical"> was found. Without it, search engines may index duplicate URLs and dilute ranking signals. Add a canonical tag pointing to the preferred URL. Read more |
|
Desktop performance needs improvement (68/100)
Warning
Medium
Score is below 90. Tackle the highest-impact audits to push into the green. Read more |
|
Mobile performance needs improvement (60/100)
Warning
Medium
Score is below 90. Tackle the highest-impact audits to push into the green. Read more |
|
9 render-blocking resources
Warning
Medium
More than 3 resources block initial rendering. Defer or async non-critical scripts and inline critical CSS to speed up first paint. Read more |
|
1 static resource without cache headers
Warning
Medium
Static assets (JS, CSS, images, fonts) are served without Cache-Control or Expires headers. Browsers will re-download them on every visit. Set long cache lifetimes with content-hashed filenames. Read more |
|
Missing lang attribute on <html>
Warning
Medium
The <html> element has no lang attribute. Screen readers and search engines use it to determine the page language. Add lang="en" (or the appropriate language code). Read more |
|
1 console error during page load
Warning
Medium
JavaScript errors or failed requests can break functionality. Open the console to investigate. Read more |
Only the top 10 of 13 suggestions are shown in the public test. To see all recommendations and track every change on your website, register now.
Did you know?
Observer tracks these signals every day and alerts you the moment something important changes. Register now.
3 Sep 2026
Expired 19 days ago
16 Jul 2026
Expired 67 days ago
Whois
- Registrar
- ODTÜ GELİŞTİRME VAKFI BİLGİ TEKNOLOJİLERİ SAN. VE TİC. A.Ş.
- Created
- 4 Sep 2000
- Updated
- 22 May 2026
- Expires
- 3 Sep 2026
- Country
- TR
SSL
- SSL available
- Yes
- SSL status
- valid
- Issuer
- C=US,O=Let's Encrypt,CN=E7
- Subject
- CN=prosim.com.tr
- TLS version
- TLSv1.3
- Self-signed
- No
- Valid until
- 16 Jul 2026
DNS Records
Current DNS records returned for this domain at the time of the test.
- DNS status
- resolved
- 188.114.96.7
- 188.114.97.7
- 2a06:98c1:3120::7
- 2a06:98c1:3121::7
No records returned.
- mail.prosim.com.tr
- elijah.ns.cloudflare.com
- meg.ns.cloudflare.com
- MS=ED77ABEF2022B02B05DD0AA3A4CC83860D46BC26
- MS=ms45268144
- MS=ms87653314
- us5j5gkvp40qu9s1v5g59grr9k
- v=spf1 +mx ip4:104.247.191.244 ip4:104.247.191.193 a:mail.prosim.com.tr ~all
Resource Summary
Transfer size share of the tested page split by resource type.
Image
2.77 MB
34 requests
78% of total size
Font
390.33 KB
16 requests
11% of total size
Script
180.84 KB
11 requests
5.0% of total size
Stylesheet
110.18 KB
19 requests
3.0% of total size
Other
101.03 KB
2 requests
2.8% of total size
Document
11.19 KB
2 requests
0.3% of total size
Media
0 B
0 requests
0.0% of total size
Third-party
1 MB
59 requests
28% of total size
Total
3.4 MB
84 requests
100% of total size
Image
2.63 MB
34 requests
77% of total size
Font
390.34 KB
16 requests
11% of total size
Script
180.86 KB
11 requests
5.2% of total size
Stylesheet
110.17 KB
19 requests
3.2% of total size
Other
101.02 KB
2 requests
2.9% of total size
Document
11.19 KB
2 requests
0.3% of total size
Media
0 B
0 requests
0.0% of total size
Third-party
884.54 KB
59 requests
25% of total size
Core Web Vitals
Key performance signals from Lighthouse, with color-coded status for what is healthy and what still needs work.
The server starts responding quickly.
Users wait too long before any content appears.
Main visible content takes too long to appear.
The layout stays visually stable while loading.
Visual loading is significantly delayed.
Main thread blocking stays in a healthy range.
Potential input delay stays low.
Users wait too long before the page responds.
TTFB
602 ms
FCP
5.29 s
LCP
17.34 s
TTI
17.46 s
The server starts responding quickly.
First visible content appears quickly.
Main visible content is slower than recommended.
Layout shifts are high and likely disruptive.
Visible content fills the page quickly.
Main thread blocking stays in a healthy range.
Potential input delay stays low.
The page becomes interactive quickly.
TTFB
161 ms
FCP
727 ms
LCP
3.03 s
TTI
3.04 s
Loading Filmstrip
Visual loading progress from the Lighthouse run, shown in time order.









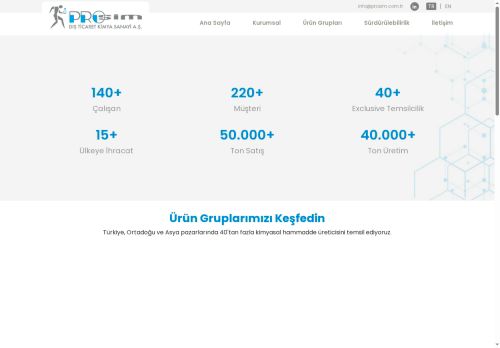
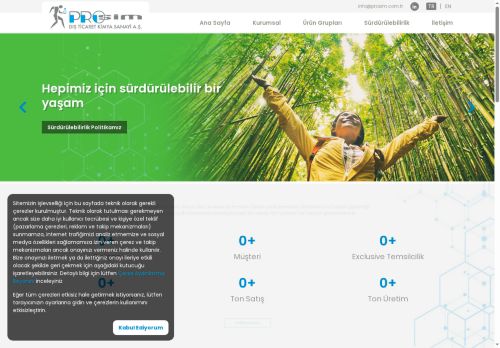





Google Pagespeed Insights
Switch between desktop and mobile Lighthouse results to review the latest performance findings for this page.
Mobile
60
Desktop
68
Audit Details
| Audit | Insight | Impact |
|---|---|---|
| Forced reflow |
A forced reflow occurs when JavaScript queries geometric properties (such as offsetWidth) after styles have been invalidated by a change to the DOM state. This can result in poor performance. Learn more about forced reflows and possible mitigations.
|
Open |
| Reduce unused JavaScript |
Reduce unused JavaScript and defer loading scripts until they are required to decrease bytes consumed by network activity. Learn how to reduce unused JavaScript.
|
Est savings of 77 KiB |
| Use efficient cache lifetimes |
A long cache lifetime can speed up repeat visits to your page. Learn more about caching.
|
Est savings of 1,768 KiB |
| Network dependency tree |
Avoid chaining critical requests by reducing the length of chains, reducing the download size of resources, or deferring the download of unnecessary resources to improve page load. |
Open |
| Render blocking requests |
Requests are blocking the page's initial render, which may delay LCP. Deferring or inlining can move these network requests out of the critical path.
|
Est savings of 1,340 ms |
| LCP breakdown |
Each subpart has specific improvement strategies. Ideally, most of the LCP time should be spent on loading the resources, not within delays. |
Open |
| Largest Contentful Paint |
Largest Contentful Paint marks the time at which the largest text or image is painted. Learn more about the Largest Contentful Paint metric |
17.3 s |
| Improve image delivery |
Reducing the download time of images can improve the perceived load time of the page and LCP. Learn more about optimizing image size
|
Est savings of 1,404 KiB |
| Time to Interactive |
Time to Interactive is the amount of time it takes for the page to become fully interactive. Learn more about the Time to Interactive metric. |
17.5 s |
| First Contentful Paint |
First Contentful Paint marks the time at which the first text or image is painted. Learn more about the First Contentful Paint metric. |
5.3 s |
| Speed Index |
Speed Index shows how quickly the contents of a page are visibly populated. Learn more about the Speed Index metric. |
6.4 s |
| Font display |
Consider setting font-display to swap or optional to ensure text is consistently visible. swap can be further optimized to mitigate layout shifts with font metric overrides.
|
Est savings of 20 ms |
| Image elements do not have explicit `width` and `height` |
Set an explicit width and height on image elements to reduce layout shifts and improve CLS. Learn how to set image dimensions
|
Open |
| Avoid enormous network payloads |
Large network payloads cost users real money and are highly correlated with long load times. Learn how to reduce payload sizes.
|
Total size was 3,629 KiB |
Audit Details
| Audit | Insight | Impact |
|---|---|---|
| Improve image delivery |
Reducing the download time of images can improve the perceived load time of the page and LCP. Learn more about optimizing image size
|
Est savings of 1,376 KiB |
| Network dependency tree |
Avoid chaining critical requests by reducing the length of chains, reducing the download size of resources, or deferring the download of unnecessary resources to improve page load. |
Open |
| Font display |
Consider setting font-display to swap or optional to ensure text is consistently visible. swap can be further optimized to mitigate layout shifts with font metric overrides.
|
Est savings of 30 ms |
| Use efficient cache lifetimes |
A long cache lifetime can speed up repeat visits to your page. Learn more about caching.
|
Est savings of 1,768 KiB |
| Layout shift culprits |
Layout shifts occur when elements move absent any user interaction. Investigate the causes of layout shifts, such as elements being added, removed, or their fonts changing as the page loads. |
Open |
| LCP request discovery |
Optimize LCP by making the LCP image discoverable from the HTML immediately, and avoiding lazy-loading |
Open |
| Avoid large layout shifts |
These are the largest layout shifts observed on the page. Each table item represents a single layout shift, and shows the element that shifted the most. Below each item are possible root causes that led to the layout shift. Some of these layout shifts may not be included in the CLS metric value due to windowing. Learn how to improve CLS
|
15 layout shifts found |
| Forced reflow |
A forced reflow occurs when JavaScript queries geometric properties (such as offsetWidth) after styles have been invalidated by a change to the DOM state. This can result in poor performance. Learn more about forced reflows and possible mitigations.
|
Open |
| Render blocking requests |
Requests are blocking the page's initial render, which may delay LCP. Deferring or inlining can move these network requests out of the critical path.
|
Est savings of 520 ms |
| Largest Contentful Paint |
Largest Contentful Paint marks the time at which the largest text or image is painted. Learn more about the Largest Contentful Paint metric |
3.0 s |
| Cumulative Layout Shift |
Cumulative Layout Shift measures the movement of visible elements within the viewport. Learn more about the Cumulative Layout Shift metric. |
0.28 |
| Avoid enormous network payloads |
Large network payloads cost users real money and are highly correlated with long load times. Learn how to reduce payload sizes.
|
Total size was 3,486 KiB |
| Image elements do not have explicit `width` and `height` |
Set an explicit width and height on image elements to reduce layout shifts and improve CLS. Learn how to set image dimensions
|
Open |
| Reduce unused JavaScript |
Reduce unused JavaScript and defer loading scripts until they are required to decrease bytes consumed by network activity. Learn how to reduce unused JavaScript.
|
Est savings of 77 KiB |
| Time to Interactive |
Time to Interactive is the amount of time it takes for the page to become fully interactive. Learn more about the Time to Interactive metric. |
3.0 s |
Browser Console Logs
Messages captured from the browser console during the real page test.
Resources by Transfer Size
Largest transferred resources captured during the browser test, sorted from heaviest to lightest.
| Resource | Type | Status | Duration | Transfer size | Decoded size | Blocking |
|---|---|---|---|---|---|---|
|
prosim.com.tr
|
css | 200 | 499 ms | 950.14 KB | 949.84 KB | non-blocking |
|
prosim.com.tr
|
css | 200 | 305 ms | 370.47 KB | 370.18 KB | non-blocking |
|
prosim.com.tr
|
css | 200 | 294 ms | 331 KB | 330.71 KB | non-blocking |
|
prosim.com.tr
|
css | 200 | 208 ms | 258.8 KB | 258.51 KB | non-blocking |
|
prosim.com.tr
|
css | 200 | 207 ms | 209.72 KB | 209.42 KB | non-blocking |
|
prosim.com.tr
|
css | 200 | 205 ms | 129.7 KB | 129.41 KB | non-blocking |
|
prosim.com.tr
|
img | 200 | 304 ms | 124.73 KB | 124.44 KB | non-blocking |
|
prosim.com.tr
|
css | 200 | 201 ms | 80.64 KB | 80.35 KB | non-blocking |
|
ajax.googleapis.com
|
script | 0 | 310 ms | 61.25 KB | 231.55 KB | non-blocking |
|
prosim.com.tr
|
css | 200 | 119 ms | 42.92 KB | 42.63 KB | non-blocking |
|
prosim.com.tr
|
css | 200 | 194 ms | 32.48 KB | 32.18 KB | non-blocking |
|
ajax.googleapis.com
|
script | 0 | 307 ms | 30.35 KB | 86.08 KB | non-blocking |
|
stackpath.bootstrapcdn.com
|
css | 0 | 187 ms | 24.49 KB | 155.78 KB | blocking |
|
stackpath.bootstrapcdn.com
|
script | 200 | 297 ms | 17.55 KB | 58.6 KB | non-blocking |
|
prosim.com.tr
|
css | 200 | 105 ms | 12.37 KB | 12.08 KB | non-blocking |
|
prosim.com.tr
|
img | 200 | 214 ms | 10.48 KB | 10.19 KB | non-blocking |
|
cdnjs.cloudflare.com
|
script | 0 | 205 ms | 10.21 KB | 43.3 KB | non-blocking |
|
cdnjs.cloudflare.com
|
css | 0 | 97 ms | 10.19 KB | 55.99 KB | blocking |
|
prosim.com.tr
|
img | 200 | 214 ms | 7.25 KB | 6.95 KB | non-blocking |
|
prosim.com.tr
|
script | 200 | 108 ms | 5.18 KB | 21.38 KB | non-blocking |
|
prosim.com.tr
|
other | 200 | 96 ms | 4.8 KB | 4.5 KB | non-blocking |
|
cdnjs.cloudflare.com
|
script | 0 | 206 ms | 4.31 KB | 14.35 KB | non-blocking |
|
prosim.com.tr
|
link | 200 | 120 ms | 4.25 KB | 18.99 KB | blocking |
|
cdnjs.cloudflare.com
|
css | 0 | 99 ms | 3.72 KB | 56.77 KB | blocking |
|
prosim.com.tr
|
iframe | 200 | 196 ms | 3.31 KB | 7.52 KB | non-blocking |
|
cdnjs.cloudflare.com
|
script | 0 | 204 ms | 2.65 KB | 8.63 KB | non-blocking |
|
cdnjs.cloudflare.com
|
css | 0 | 104 ms | 1.7 KB | 25.44 KB | blocking |
|
prosim.com.tr
|
link | 200 | 122 ms | 1.62 KB | 3.92 KB | blocking |
|
cdnjs.cloudflare.com
|
css | 0 | 98 ms | 1.12 KB | 3.27 KB | blocking |
|
prosim.com.tr
|
script | 200 | 212 ms | 1.03 KB | 1.86 KB | non-blocking |
| script | 200 | 17 ms | 961 B | 1.21 KB | non-blocking | |
|
fonts.googleapis.com
|
css | 0 | 290 ms | 841 B | 4.68 KB | blocking |
|
cdnjs.cloudflare.com
|
script | 0 | 207 ms | 773 B | 1.04 KB | non-blocking |
|
prosim.com.tr
|
link | 200 | 113 ms | 539 B | 528 B | blocking |
|
prosim.com.tr
|
xmlhttprequest | 200 | 187 ms | 383 B | 78 B | non-blocking |
|
www.algoritmik.net
|
css | 0 | 153 ms | 0 B | 0 B | non-blocking |
Get daily monitoring and instant alerts with Observer.
Register Observer to keep testing your website automatically and react faster when something breaks.
Try Observer Discover