Total
166.21 KB
3 requests
100% of total size
SSL certificate expires soon
The SSL certificate is due to expire on 19 Oct 2026.
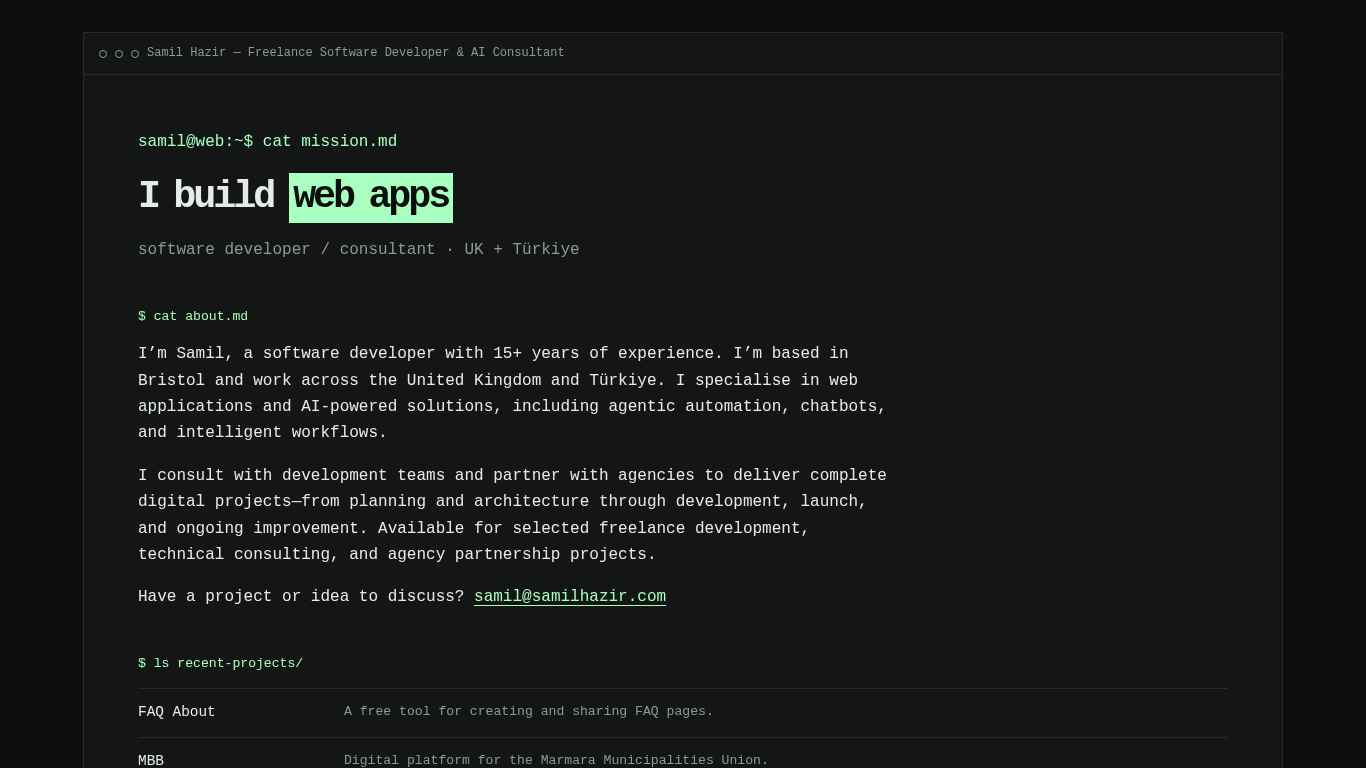
Screenshot captured after 694 ms.
Freelance Software Developer & AI Consultant in Bristol | Samil Hazir
See the website health and performance test results for https://samilhazir.com/, including status code, load speed, SSL, WHOIS, DNS, console logs, Chrome UX Report, resource sizes, and Pagespeed findings.
Tested on 30 Jul 2026 21:54:15.
Up
- HTTP status 200
- Response time 534 ms
- Document load time 184 ms
- Full page load time 694 ms
- Document size 16.68 KB
- Full page size 520 B
100/100
- Mobile score 100
- Desktop score 100
Observer's Performance Suggestions
Priority actions Observer identified from this test to improve speed, reliability, and user experience.
|
Missing clickjacking protection
Error
High
The page has neither an X-Frame-Options header nor a CSP frame-ancestors directive, so it can be embedded in an iframe on any site, making it vulnerable to clickjacking attacks. Read more |
|
Missing Strict-Transport-Security header
Warning
High
Without HSTS, browsers can be tricked into loading the site over plain HTTP, exposing traffic to interception. Add a Strict-Transport-Security header with a long max-age. Read more |
|
1 console error during page load
Warning
Medium
JavaScript errors or failed requests can break functionality. Open the console to investigate. Read more |
|
No SPF record found
Warning
Low
Without an SPF record, receiving mail servers cannot verify which hosts are authorized to send email for this domain. Add a TXT record starting with "v=spf1". Read more |
|
Response headers expose server information
Warning
Low
The following headers reveal server software: server: cloudflare. Remove or genericize these headers to reduce information leakage for attackers. Read more |
|
DNSSEC is not enabled
Info
Low
The domain does not use DNSSEC, leaving DNS responses vulnerable to spoofing and cache poisoning. Enable DNSSEC through your registrar and DNS provider. Read more |
Did you know?
Observer tracks these signals every day and alerts you the moment something important changes. Register now.
13 Jul 2027
295 days left
19 Oct 2026
28 days left
Whois
- Registrar
- Cloudflare, Inc.
- Created
- 13 Jul 2006
- Updated
- 21 Jul 2026
- Expires
- 13 Jul 2027
- Country
- GB
- DNSSEC
- unsigned
SSL
- SSL available
- Yes
- SSL status
- valid
- Issuer
- C=US,O=Google Trust Services,CN=WE1
- Subject
- CN=samilhazir.com
- TLS version
- TLSv1.3
- Self-signed
- No
- Valid until
- 19 Oct 2026
DNS Records
Current DNS records returned for this domain at the time of the test.
- DNS status
- resolved
- 104.21.48.129
- 172.67.151.155
- 2606:4700:3036::ac43:979b
- 2606:4700:3037::6815:3081
No records returned.
- alt1.aspmx.l.google.com
- alt2.aspmx.l.google.com
- aspmx.l.google.com
- aspmx2.googlemail.com
- aspmx3.googlemail.com
- aspmx4.googlemail.com
- aspmx5.googlemail.com
- bella.ns.cloudflare.com
- brett.ns.cloudflare.com
- google-site-verification=aFP0PvoBx8GpDlj0NuLd0FVrjPxNf4cLNoVkU9fE6JQ
Resource Summary
Transfer size share of the tested page split by resource type.
Script
160.06 KB
1 requests
96% of total size
Document
5.37 KB
1 requests
3.2% of total size
Other
798 B
1 requests
0.5% of total size
Stylesheet
0 B
0 requests
0.0% of total size
Image
0 B
0 requests
0.0% of total size
Media
0 B
0 requests
0.0% of total size
Font
0 B
0 requests
0.0% of total size
Third-party
160.84 KB
2 requests
97% of total size
Total
166.22 KB
3 requests
100% of total size
Script
160.06 KB
1 requests
96% of total size
Document
5.38 KB
1 requests
3.2% of total size
Other
798 B
1 requests
0.5% of total size
Stylesheet
0 B
0 requests
0.0% of total size
Image
0 B
0 requests
0.0% of total size
Media
0 B
0 requests
0.0% of total size
Font
0 B
0 requests
0.0% of total size
Third-party
160.84 KB
2 requests
97% of total size
Core Web Vitals
Key performance signals from Lighthouse, with color-coded status for what is healthy and what still needs work.
The server starts responding quickly.
First visible content appears quickly.
Main visible content loads within the recommended range.
The layout stays visually stable while loading.
Visible content fills the page quickly.
Main thread blocking stays in a healthy range.
Potential input delay stays low.
The page becomes interactive quickly.
TTFB
601 ms
FCP
763 ms
LCP
763 ms
TTI
763 ms
The server starts responding quickly.
First visible content appears quickly.
Main visible content loads within the recommended range.
The layout stays visually stable while loading.
Visible content fills the page quickly.
Main thread blocking stays in a healthy range.
Potential input delay stays low.
The page becomes interactive quickly.
TTFB
162 ms
FCP
220 ms
LCP
220 ms
TTI
778 ms
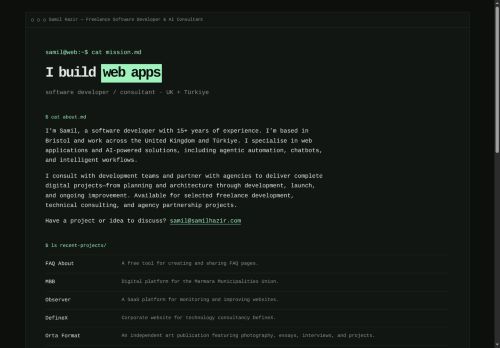
Loading Filmstrip
Visual loading progress from the Lighthouse run, shown in time order.















Google Pagespeed Insights
Switch between desktop and mobile Lighthouse results to review the latest performance findings for this page.
Mobile
100
Desktop
100
Audit Details
| Audit | Insight | Impact |
|---|---|---|
| Reduce unused JavaScript |
Reduce unused JavaScript and defer loading scripts until they are required to decrease bytes consumed by network activity. Learn how to reduce unused JavaScript.
|
Est savings of 67 KiB |
Audit Details
| Audit | Insight | Impact |
|---|---|---|
| Reduce unused JavaScript |
Reduce unused JavaScript and defer loading scripts until they are required to decrease bytes consumed by network activity. Learn how to reduce unused JavaScript.
|
Est savings of 67 KiB |
Browser Console Logs
Messages captured from the browser console during the real page test.
Resources by Transfer Size
Largest transferred resources captured during the browser test, sorted from heaviest to lightest.
| Resource | Type | Status | Duration | Transfer size | Decoded size | Blocking |
|---|---|---|---|---|---|---|
|
samilhazir.com
|
other | 200 | 59 ms | 520 B | 328 B | non-blocking |
|
www.googletagmanager.com
|
script | 0 | 269 ms | 0 B | 0 B | non-blocking |
| fetch | 0 | 209 ms | 0 B | 0 B | non-blocking |
Previous Test Results
Get daily monitoring and instant alerts with Observer.
Register Observer to keep testing your website automatically and react faster when something breaks.
Try Observer Discover