Total
6.75 MB
108 requests
100% of total size

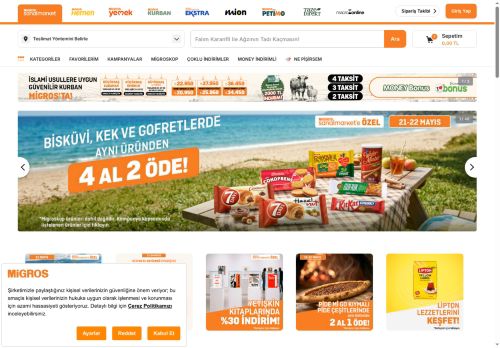
Screenshot captured after 5.26 s.
Migros Sanal Market | Online Market Alışverişi
See the website health and performance test results for https://www.migros.com.tr/, including status code, load speed, SSL, WHOIS, DNS, console logs, Chrome UX Report, resource sizes, and Pagespeed findings.
Tested on 21 May 2026 13:45:26.
Up
- HTTP status 200
- Response time 504 ms
- Document load time 2.68 s
- Full page load time 5.26 s
- Document size 216.68 KB
- Full page size 409.74 KB
26/100
- Mobile score 26
- Desktop score 50
Observer's Performance Suggestions
Priority actions Observer identified from this test to improve speed, reliability, and user experience.
|
Poor mobile performance score (26/100)
Error
High
Lighthouse rates this page as poor. Address render-blocking, image, and JavaScript audits below. Read more |
|
24 images served larger than displayed
Error
Medium
24 images are served at intrinsic dimensions more than 120% of their display size. Worst offender is 409% of display size. Resize images to match their rendered dimensions to save bandwidth. Read more |
|
No H1 element found
Error
Low
The page is missing an <h1> tag. An H1 heading helps search engines and screen readers understand the primary topic of the page. Read more |
|
High Total Blocking Time (1421 ms)
Warning
High
Long JavaScript tasks block the main thread, making the page feel unresponsive. Split long tasks, defer non-critical scripts, and reduce third-party JavaScript. Read more |
|
Slow Speed Index (12.3 s)
Warning
High
The page takes too long to visually complete. Optimize critical rendering path, reduce render-blocking resources, and serve visible content first. Read more |
|
Mobile score is 24 points lower than desktop
Warning
High
Desktop scores 50/100 but mobile only 26/100. Optimize for mobile CPU, network and viewport — most real-world traffic is mobile. Read more |
|
LCP image resource load is slow
Warning
High
The p75 LCP image resource load delay is 2045 ms. Optimize image delivery with a CDN, caching, or smaller formats to reduce load time. Read more |
|
Desktop performance needs improvement (50/100)
Warning
Medium
Score is below 90. Tackle the highest-impact audits to push into the green. Read more |
|
High Total Blocking Time (411 ms)
Warning
Medium
Long JavaScript tasks block the main thread, making the page feel unresponsive. Split long tasks, defer non-critical scripts, and reduce third-party JavaScript. Read more |
|
Fewer than 75% of users have a good Largest Contentful Paint
Warning
Medium
Only 67% of real-user samples fall in the "good" bucket for Largest Contentful Paint. Read more |
Only the top 10 of 24 suggestions are shown in the public test. To see all recommendations and track every change on your website, register now.
Did you know?
Observer tracks these signals every day and alerts you the moment something important changes. Register now.
8 Feb 2027
238 days left
10 Aug 2026
57 days left
Whois
- Registrar
- ODTÜ GELİŞTİRME VAKFI BİLGİ TEKNOLOJİLERİ SAN. VE TİC. A.Ş.
- Created
- 9 Feb 1996
- Updated
- 21 May 2026
- Expires
- 8 Feb 2027
- Country
- TR
SSL
- SSL available
- Yes
- SSL status
- valid
- Issuer
- C=BE,O=GlobalSign nv-sa,CN=GlobalSign RSA OV SSL CA 2018
- Subject
- C=TR,ST=İSTANBUL,L=ATAŞEHİR,O=MİGROS TİCARET A.Ş.,CN=*.migros.com.tr
- TLS version
- TLSv1.3
- Self-signed
- No
- Valid until
- 10 Aug 2026
DNS Records
Current DNS records returned for this domain at the time of the test.
- DNS status
- resolved
- 104.18.41.117
- 172.64.146.139
- 2a06:98c1:3103::6812:2975
- 2a06:98c1:3103::ac40:928b
- www.migros.com.tr.cdn.cloudflare.net
- mxa-00953902.gslb.pphosted.com
- mxb-00953902.gslb.pphosted.com
- dnsa1.vodafone.net.tr
- dnsa2.vodafone.net.tr
- dnx1.vodafone.net.tr
- dnx2.vodafone.net.tr
- 6Gr2vD8Xth7DPX3YbniKrIimyJ9ZOMxeH7RqD3ApNGg=
- MS=ms27777964
- apple-domain-verification=aZO2mznu9QoDMMKh
- cursor-domain-verification-fnk2tr=i2W3UQXOP5ls1RVLMnMXJv7u7
- globalsign-domain-verification=Cp93X4NeAkdAWt93fqCpmYFor5fc-wwWUgMUuEslAU
- globalsign-domain-verification=FJIJzKNM4Sk_0pkKoApLSYGEJBfeGV4Vz9l2estO1i
- globalsign-domain-verification=afhTDWhtaPV-It6e7FOOuDvU1m-ZN89TK7TlhnTCLL
- globalsign-domain-verification=eqfILAs5kfUjJr-pWAAsXmmyWLhX7YAkZronUQuUKF
- google-gws-recovery-domain-verification=43297419
- google-gws-recovery-domain-verification=44068956
- google-site-verification=QyduSIMAn7NpNVHpMvX6ZtuGNyQeutHXUMb3GuKC3ys
- google-site-verification=RA-zfdctcgn7Af6aVmt7IcAzVzeAwUYpqyzTvDObpwE
- mixpanel-domain-verify=cd6f691d-63aa-460b-92f3-6d342e848ff1
- pquS870DLP95cYWIT0igfUQsPMwdg6mdkk/AjTW/SMo=
- v=spf1 ip4:31.145.140.18 ip4:84.44.33.6 include:spf.protection.outlook.com include:spf-00953902.pphosted.com -all
Resource Summary
Transfer size share of the tested page split by resource type.
Image
4.15 MB
55 requests
61% of total size
Script
2.27 MB
20 requests
34% of total size
Font
131.78 KB
2 requests
1.9% of total size
Other
91.5 KB
27 requests
1.3% of total size
Stylesheet
79.44 KB
1 requests
1.1% of total size
Document
41.26 KB
3 requests
0.6% of total size
Media
0 B
0 requests
0.0% of total size
Third-party
6.34 MB
73 requests
94% of total size
Total
7.46 MB
122 requests
100% of total size
Image
5.03 MB
73 requests
67% of total size
Script
2.1 MB
19 requests
28% of total size
Font
131.78 KB
2 requests
1.7% of total size
Other
89.92 KB
24 requests
1.2% of total size
Stylesheet
79.44 KB
1 requests
1.0% of total size
Document
42.17 KB
3 requests
0.6% of total size
Media
0 B
0 requests
0.0% of total size
Third-party
7.15 MB
96 requests
96% of total size
Core Web Vitals
Key performance signals from Lighthouse, with color-coded status for what is healthy and what still needs work.
The server starts responding quickly.
Users wait too long before any content appears.
Main visible content takes too long to appear.
Some layout movement still affects the experience.
Visual loading is significantly delayed.
Heavy blocking is likely hurting responsiveness.
Potential input delay is high.
Users wait too long before the page responds.
TTFB
601 ms
FCP
10.15 s
LCP
17.25 s
TTI
24.55 s
The server starts responding quickly.
First visible content appears quickly.
Main visible content takes too long to appear.
The layout stays visually stable while loading.
Visible content fills the page quickly.
Script execution still delays interactivity.
Potential input delay may still feel sluggish.
Interactivity takes longer than recommended.
TTFB
161 ms
FCP
1.64 s
LCP
4.06 s
TTI
4.37 s
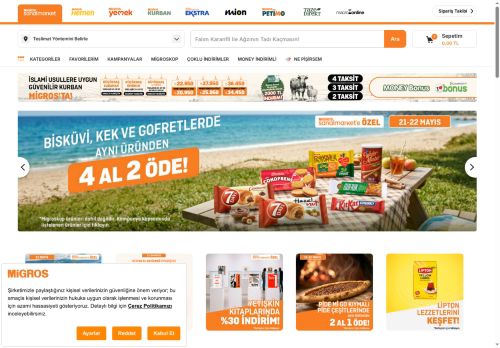
Loading Filmstrip
Visual loading progress from the Lighthouse run, shown in time order.


Google Pagespeed Insights
Switch between desktop and mobile Lighthouse results to review the latest performance findings for this page.
Mobile
26
Desktop
50
Audit Details
| Audit | Insight | Impact |
|---|---|---|
| Layout shift culprits |
Layout shifts occur when elements move absent any user interaction. Investigate the causes of layout shifts, such as elements being added, removed, or their fonts changing as the page loads. |
Open |
| Avoid large layout shifts |
These are the largest layout shifts observed on the page. Each table item represents a single layout shift, and shows the element that shifted the most. Below each item are possible root causes that led to the layout shift. Some of these layout shifts may not be included in the CLS metric value due to windowing. Learn how to improve CLS
|
3 layout shifts found |
| Reduce unused JavaScript |
Reduce unused JavaScript and defer loading scripts until they are required to decrease bytes consumed by network activity. Learn how to reduce unused JavaScript.
|
Est savings of 1,039 KiB |
| Legacy JavaScript |
Polyfills and transforms enable older browsers to use new JavaScript features. However, many aren't necessary for modern browsers. Consider modifying your JavaScript build process to not transpile Baseline features, unless you know you must support older browsers. Learn why most sites can deploy ES6+ code without transpiling
|
Est savings of 13 KiB |
| First Contentful Paint |
First Contentful Paint marks the time at which the first text or image is painted. Learn more about the First Contentful Paint metric. |
10.1 s |
| Reduce unused CSS |
Reduce unused rules from stylesheets and defer CSS not used for above-the-fold content to decrease bytes consumed by network activity. Learn how to reduce unused CSS.
|
Est savings of 71 KiB |
| Minimize main-thread work |
Consider reducing the time spent parsing, compiling and executing JS. You may find delivering smaller JS payloads helps with this. Learn how to minimize main-thread work |
8.8 s |
| Forced reflow |
A forced reflow occurs when JavaScript queries geometric properties (such as offsetWidth) after styles have been invalidated by a change to the DOM state. This can result in poor performance. Learn more about forced reflows and possible mitigations.
|
Open |
| LCP request discovery |
Optimize LCP by making the LCP image discoverable from the HTML immediately, and avoiding lazy-loading |
Open |
| Network dependency tree |
Avoid chaining critical requests by reducing the length of chains, reducing the download size of resources, or deferring the download of unnecessary resources to improve page load. |
Open |
| Largest Contentful Paint |
Largest Contentful Paint marks the time at which the largest text or image is painted. Learn more about the Largest Contentful Paint metric |
17.2 s |
| Time to Interactive |
Time to Interactive is the amount of time it takes for the page to become fully interactive. Learn more about the Time to Interactive metric. |
24.6 s |
| Render blocking requests |
Requests are blocking the page's initial render, which may delay LCP. Deferring or inlining can move these network requests out of the critical path.
|
Est savings of 1,910 ms |
| Reduce JavaScript execution time |
Consider reducing the time spent parsing, compiling, and executing JS. You may find delivering smaller JS payloads helps with this. Learn how to reduce Javascript execution time.
|
5.1 s |
| Use efficient cache lifetimes |
A long cache lifetime can speed up repeat visits to your page. Learn more about caching.
|
Est savings of 5 KiB |
| Max Potential First Input Delay |
The maximum potential First Input Delay that your users could experience is the duration of the longest task. Learn more about the Maximum Potential First Input Delay metric. |
690 ms |
| Speed Index |
Speed Index shows how quickly the contents of a page are visibly populated. Learn more about the Speed Index metric. |
12.3 s |
| Total Blocking Time |
Sum of all time periods between FCP and Time to Interactive, when task length exceeded 50ms, expressed in milliseconds. Learn more about the Total Blocking Time metric. |
1,420 ms |
| Avoid enormous network payloads |
Large network payloads cost users real money and are highly correlated with long load times. Learn how to reduce payload sizes.
|
Total size was 6,913 KiB |
| Improve image delivery |
Reducing the download time of images can improve the perceived load time of the page and LCP. Learn more about optimizing image size
|
Est savings of 3,869 KiB |
| Cumulative Layout Shift |
Cumulative Layout Shift measures the movement of visible elements within the viewport. Learn more about the Cumulative Layout Shift metric. |
0.122 |
Audit Details
| Audit | Insight | Impact |
|---|---|---|
| Reduce unused JavaScript |
Reduce unused JavaScript and defer loading scripts until they are required to decrease bytes consumed by network activity. Learn how to reduce unused JavaScript.
|
Est savings of 936 KiB |
| Network dependency tree |
Avoid chaining critical requests by reducing the length of chains, reducing the download size of resources, or deferring the download of unnecessary resources to improve page load. |
Open |
| Forced reflow |
A forced reflow occurs when JavaScript queries geometric properties (such as offsetWidth) after styles have been invalidated by a change to the DOM state. This can result in poor performance. Learn more about forced reflows and possible mitigations.
|
Open |
| Reduce JavaScript execution time |
Consider reducing the time spent parsing, compiling, and executing JS. You may find delivering smaller JS payloads helps with this. Learn how to reduce Javascript execution time.
|
2.0 s |
| Legacy JavaScript |
Polyfills and transforms enable older browsers to use new JavaScript features. However, many aren't necessary for modern browsers. Consider modifying your JavaScript build process to not transpile Baseline features, unless you know you must support older browsers. Learn why most sites can deploy ES6+ code without transpiling
|
Est savings of 13 KiB |
| Minimize main-thread work |
Consider reducing the time spent parsing, compiling and executing JS. You may find delivering smaller JS payloads helps with this. Learn how to minimize main-thread work |
4.1 s |
| Render blocking requests |
Requests are blocking the page's initial render, which may delay LCP. Deferring or inlining can move these network requests out of the critical path.
|
Est savings of 350 ms |
| Reduce unused CSS |
Reduce unused rules from stylesheets and defer CSS not used for above-the-fold content to decrease bytes consumed by network activity. Learn how to reduce unused CSS.
|
Est savings of 71 KiB |
| Improve image delivery |
Reducing the download time of images can improve the perceived load time of the page and LCP. Learn more about optimizing image size
|
Est savings of 4,610 KiB |
| Largest Contentful Paint |
Largest Contentful Paint marks the time at which the largest text or image is painted. Learn more about the Largest Contentful Paint metric |
4.1 s |
| Total Blocking Time |
Sum of all time periods between FCP and Time to Interactive, when task length exceeded 50ms, expressed in milliseconds. Learn more about the Total Blocking Time metric. |
410 ms |
| Speed Index |
Speed Index shows how quickly the contents of a page are visibly populated. Learn more about the Speed Index metric. |
2.4 s |
| First Contentful Paint |
First Contentful Paint marks the time at which the first text or image is painted. Learn more about the First Contentful Paint metric. |
1.6 s |
| Avoid enormous network payloads |
Large network payloads cost users real money and are highly correlated with long load times. Learn how to reduce payload sizes.
|
Total size was 7,642 KiB |
| Use efficient cache lifetimes |
A long cache lifetime can speed up repeat visits to your page. Learn more about caching.
|
Est savings of 5 KiB |
| Time to Interactive |
Time to Interactive is the amount of time it takes for the page to become fully interactive. Learn more about the Time to Interactive metric. |
4.4 s |
| Max Potential First Input Delay |
The maximum potential First Input Delay that your users could experience is the duration of the longest task. Learn more about the Maximum Potential First Input Delay metric. |
190 ms |
Browser Console Logs
Messages captured from the browser console during the real page test.
warn
[GPT] PubAdsService.setTargeting is deprecated, use googletag.setConfig({targeting: ...}) instead.
https://goo.gle/gpt-message#170
Chrome UX Report
Real-user experience shares from recent Chrome visits to this website.
Origin: https://www.migros.com.tr
Mobile 79.7%
Desktop 16.9%
Tablet 3.4%
| Metric | User experience share | 75th percentile |
|---|---|---|
| LCP |
Good 66.8%
Needs improvement 19.4%
Poor 13.8%
|
2.96 s |
| INP |
Good 65.3%
Needs improvement 24.7%
Poor 9.9%
|
265 ms |
| CLS |
Good 83.4%
Needs improvement 10.1%
Poor 6.5%
|
0.06 |
| FCP |
Good 72.1%
Needs improvement 18.2%
Poor 9.6%
|
1.91 s |
| TTFB |
Good 65.0%
Needs improvement 27.8%
Poor 7.2%
|
997 ms |
Resources by Transfer Size
Largest transferred resources captured during the browser test, sorted from heaviest to lightest.
| Resource | Type | Status | Duration | Transfer size | Decoded size | Blocking |
|---|---|---|---|---|---|---|
|
pagead2.googlesyndication.com
|
script | 0 | 87 ms | 187.4 KB | 594.94 KB | non-blocking |
|
www.migros.com.tr
|
img | 200 | 109 ms | 107.48 KB | 107.19 KB | non-blocking |
|
pagead2.googlesyndication.com
|
script | 0 | 264 ms | 34.3 KB | 108.72 KB | non-blocking |
|
pagead2.googlesyndication.com
|
link | 200 | 85 ms | 22.93 KB | 63.6 KB | non-blocking |
|
ep1.adtrafficquality.google
|
xmlhttprequest | 200 | 200 ms | 13.63 KB | 17.67 KB | non-blocking |
|
www.migros.com.tr
|
fetch | 200 | 86 ms | 11.54 KB | 167.78 KB | non-blocking |
|
www.migros.com.tr
|
fetch | 200 | 114 ms | 8.21 KB | 28.43 KB | non-blocking |
|
d0d19ee0c6b2a925e726876027ead834.safeframe.googlesyndication.com
|
iframe | 0 | 365 ms | 3.34 KB | 7.23 KB | non-blocking |
| fetch | 200 | 275 ms | 2.66 KB | 14.8 KB | non-blocking | |
|
www.migros.com.tr
|
fetch | 200 | 195 ms | 2.41 KB | 17.16 KB | non-blocking |
|
www.migros.com.tr
|
fetch | 200 | 93 ms | 2.3 KB | 5.2 KB | non-blocking |
|
www.migros.com.tr
|
other | 200 | 97 ms | 2.11 KB | 1.82 KB | non-blocking |
|
www.migros.com.tr
|
script | 200 | 60 ms | 1.34 KB | 3.36 KB | blocking |
|
www.migros.com.tr
|
other | 200 | 91 ms | 1.2 KB | 903 B | non-blocking |
|
www.migros.com.tr
|
img | 200 | 206 ms | 1 KB | 724 B | non-blocking |
| fetch | 200 | 268 ms | 964 B | 2.18 KB | non-blocking | |
|
www.migros.com.tr
|
other | 200 | 80 ms | 935 B | 635 B | non-blocking |
|
www.migros.com.tr
|
fetch | 200 | 173 ms | 825 B | 1.26 KB | non-blocking |
| fetch | 200 | 183 ms | 782 B | 6.84 KB | non-blocking | |
|
www.migros.com.tr
|
link | 200 | 190 ms | 594 B | 1.03 KB | non-blocking |
|
www.migros.com.tr
|
fetch | 200 | 96 ms | 592 B | 689 B | non-blocking |
|
www.migros.com.tr
|
fetch | 200 | 74 ms | 521 B | 504 B | non-blocking |
|
www.migros.com.tr
|
script | 200 | 62 ms | 448 B | 179 B | blocking |
|
www.migros.com.tr
|
fetch | 200 | 79 ms | 428 B | 144 B | non-blocking |
|
www.migros.com.tr
|
fetch | 200 | 102 ms | 369 B | 69 B | non-blocking |
|
www.migros.com.tr
|
fetch | 200 | 93 ms | 354 B | 34 B | non-blocking |
|
www.migros.com.tr
|
fetch | 200 | 157 ms | 322 B | 2 B | non-blocking |
|
www.migros.com.tr
|
fetch | 200 | 119 ms | 322 B | 2 B | non-blocking |
|
www.migros.com.tr
|
fetch | 200 | 158 ms | 322 B | 2 B | non-blocking |
|
www.migros.com.tr
|
xmlhttprequest | 204 | 84 ms | 300 B | 0 B | non-blocking |
|
assets.migrosone.com
|
link | 0 | 79 ms | 0 B | 0 B | blocking |
|
assets.migrosone.com
|
other | 200 | 174 ms | 0 B | 0 B | non-blocking |
|
assets.migrosone.com
|
script | 200 | 173 ms | 0 B | 0 B | non-blocking |
|
assets.migrosone.com
|
script | 0 | 177 ms | 0 B | 0 B | non-blocking |
|
assets.migrosone.com
|
script | 200 | 173 ms | 0 B | 0 B | non-blocking |
|
assets.migrosone.com
|
script | 0 | 79 ms | 0 B | 0 B | non-blocking |
|
static.cloudflareinsights.com
|
script | 200 | 459 ms | 0 B | 0 B | non-blocking |
|
assets.migrosone.com
|
css | 0 | 6 ms | 0 B | 0 B | non-blocking |
|
assets.migrosone.com
|
css | 0 | 85 ms | 0 B | 0 B | non-blocking |
|
assets.migrosone.com
|
css | 0 | 88 ms | 0 B | 0 B | non-blocking |
|
assets.migrosone.com
|
css | 0 | 91 ms | 0 B | 0 B | non-blocking |
|
assets.migrosone.com
|
css | 0 | 98 ms | 0 B | 0 B | non-blocking |
|
assets.migrosone.com
|
css | 0 | 100 ms | 0 B | 0 B | non-blocking |
|
assets.migrosone.com
|
css | 0 | 101 ms | 0 B | 0 B | non-blocking |
|
assets.migrosone.com
|
css | 0 | 102 ms | 0 B | 0 B | non-blocking |
|
assets.migrosone.com
|
css | 0 | 103 ms | 0 B | 0 B | non-blocking |
|
assets.migrosone.com
|
css | 0 | 181 ms | 0 B | 0 B | non-blocking |
|
images.migrosone.com
|
img | 0 | 295 ms | 0 B | 0 B | non-blocking |
|
images.migrosone.com
|
img | 0 | 307 ms | 0 B | 0 B | non-blocking |
|
images.migrosone.com
|
img | 0 | 301 ms | 0 B | 0 B | non-blocking |
Get daily monitoring and instant alerts with Observer.
Register Observer to keep testing your website automatically and react faster when something breaks.
Try Observer Discover